Fig. 9.
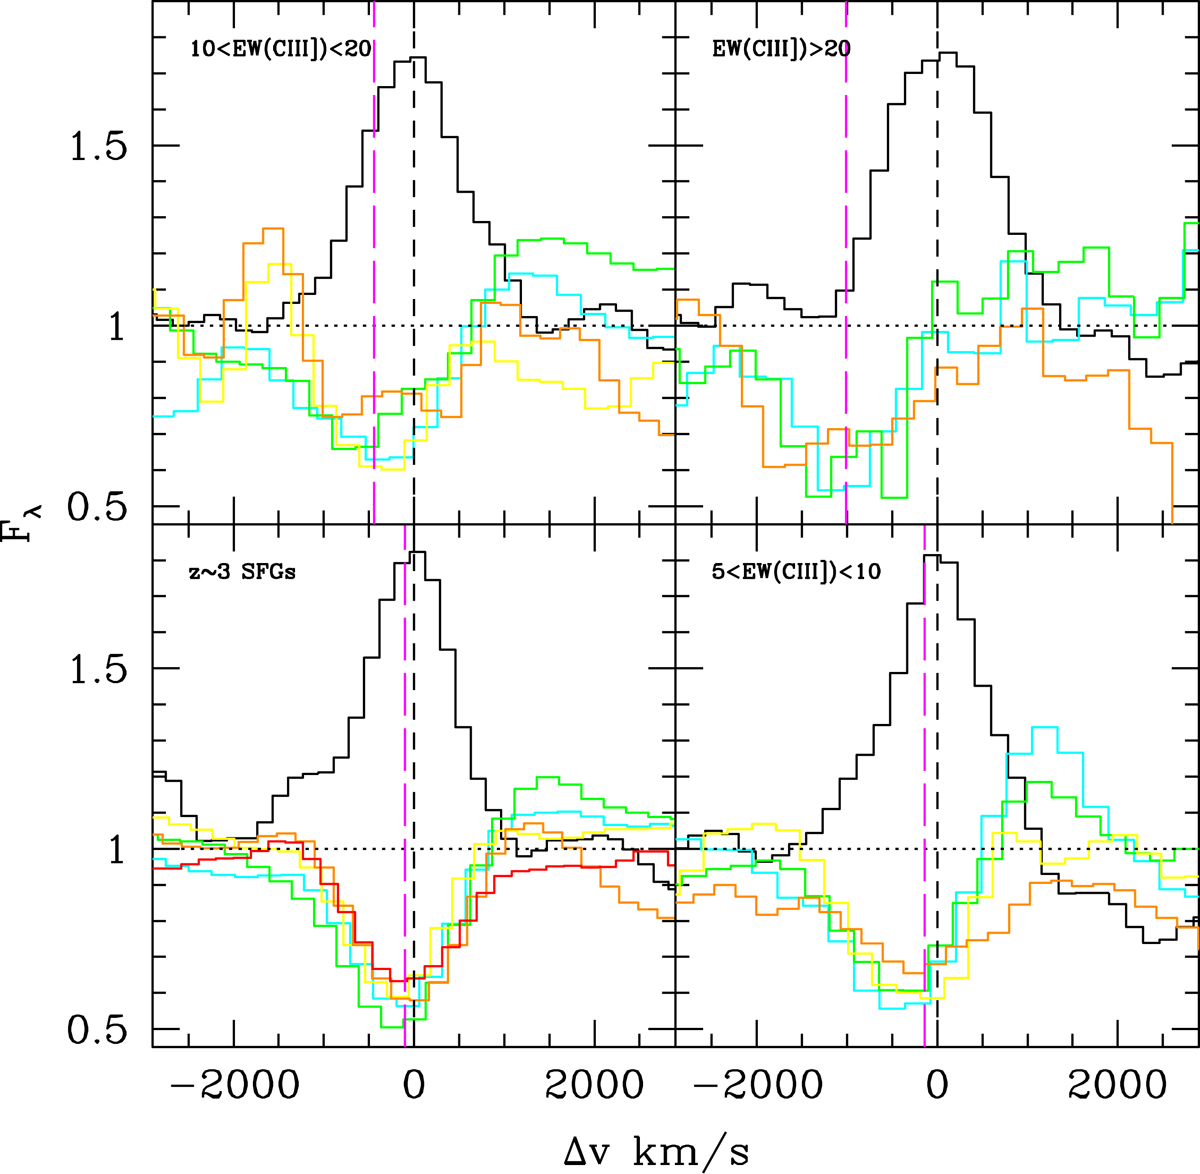
Relative velocity of the main ISM absorption lines with respect to CIII]-λ1908 Å taken as systemic velocity for the SFG population and samples with increasing EW(CIII]). CIII] is plotted in black, and depending on the sample, SiII-λ1260 is drawn in cyan, SiII-λ1303 in green, CII-λ1334 in yellow, 1526 in orange, and 1670 in red. The mean outflow velocities (see text) are indicated as the long-dashed magenta lines.
Current usage metrics show cumulative count of Article Views (full-text article views including HTML views, PDF and ePub downloads, according to the available data) and Abstracts Views on Vision4Press platform.
Data correspond to usage on the plateform after 2015. The current usage metrics is available 48-96 hours after online publication and is updated daily on week days.
Initial download of the metrics may take a while.