Fig. 8.
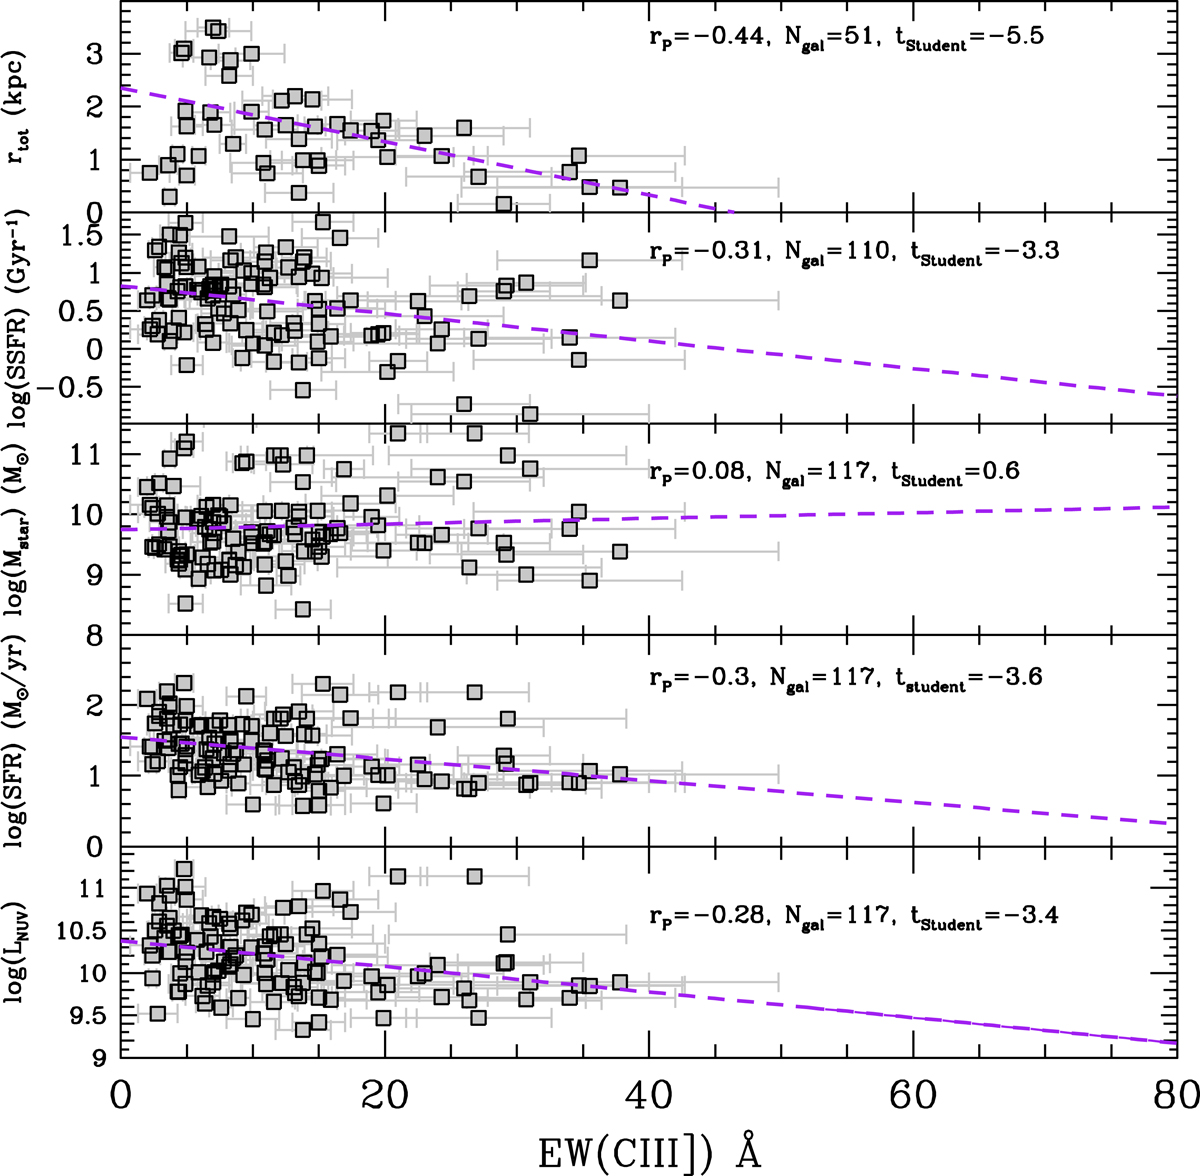
Properties of CIII] emitters, from bottom to top: LNUV, SFR, Mstar, SSFR, and total size properties of CIII] emitters as a function of EW(CIII]). A least-squares fit to the data is shown as the purple dashed lines, and the Pearson correlation coefficient rP, number of objects, and the significance of the correlation (Student t-test) are indicated in the upper right corner of each panel. The rtot measurements are limited to the COSMOS and ECDFS fields for which HST imaging is available (Ribeiro et al. 2016).
Current usage metrics show cumulative count of Article Views (full-text article views including HTML views, PDF and ePub downloads, according to the available data) and Abstracts Views on Vision4Press platform.
Data correspond to usage on the plateform after 2015. The current usage metrics is available 48-96 hours after online publication and is updated daily on week days.
Initial download of the metrics may take a while.