Fig. 7.
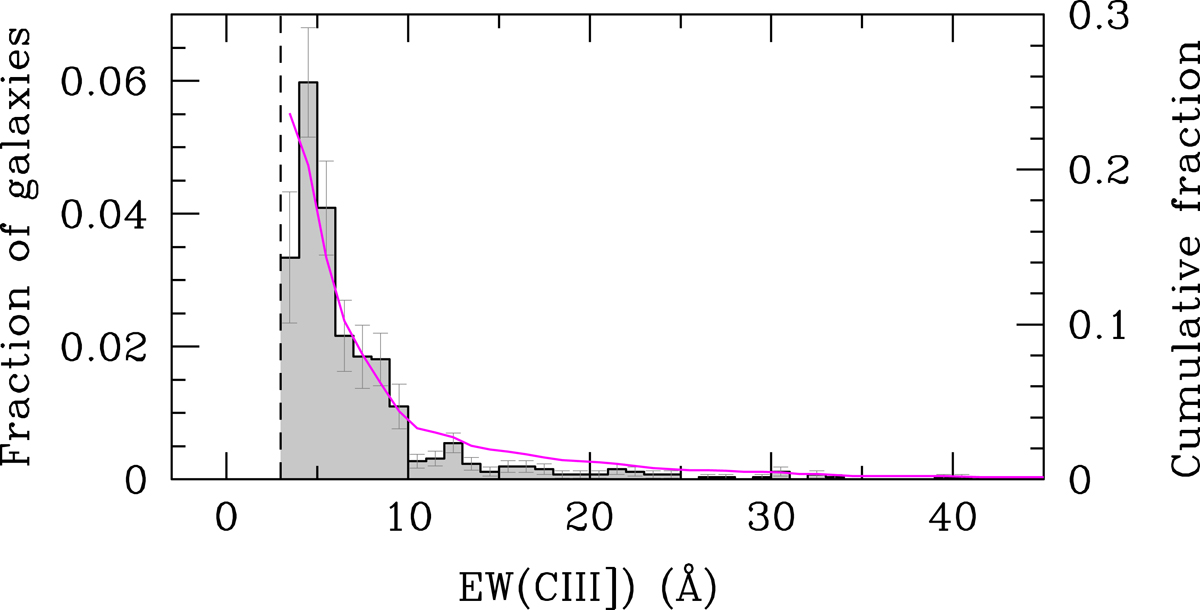
Distribution of CIII]-λ1908 equivalent width EW(CIII]) in the UV-selected star-forming population at 2 < z < 3.8. The shaded histogram shows the fraction of galaxies with a given EW(CIII]) in bins of δEW = 1 Å (left Y-axis), with Poisson uncertainties from the population statistics indicated as error bars. The cumulative fraction of galaxies with EW(CIII]) above a given EW(CIII]) limit is drawn as the continuous magenta line (values on the right Y-axis), relative to the total population of SFGs at that redshift. About 24% of SFGs with 2 < z < 3.8 present CIII]-λ1908 Å emission with EW(CIII]) ≥ 3 Å.
Current usage metrics show cumulative count of Article Views (full-text article views including HTML views, PDF and ePub downloads, according to the available data) and Abstracts Views on Vision4Press platform.
Data correspond to usage on the plateform after 2015. The current usage metrics is available 48-96 hours after online publication and is updated daily on week days.
Initial download of the metrics may take a while.