Fig. 6.
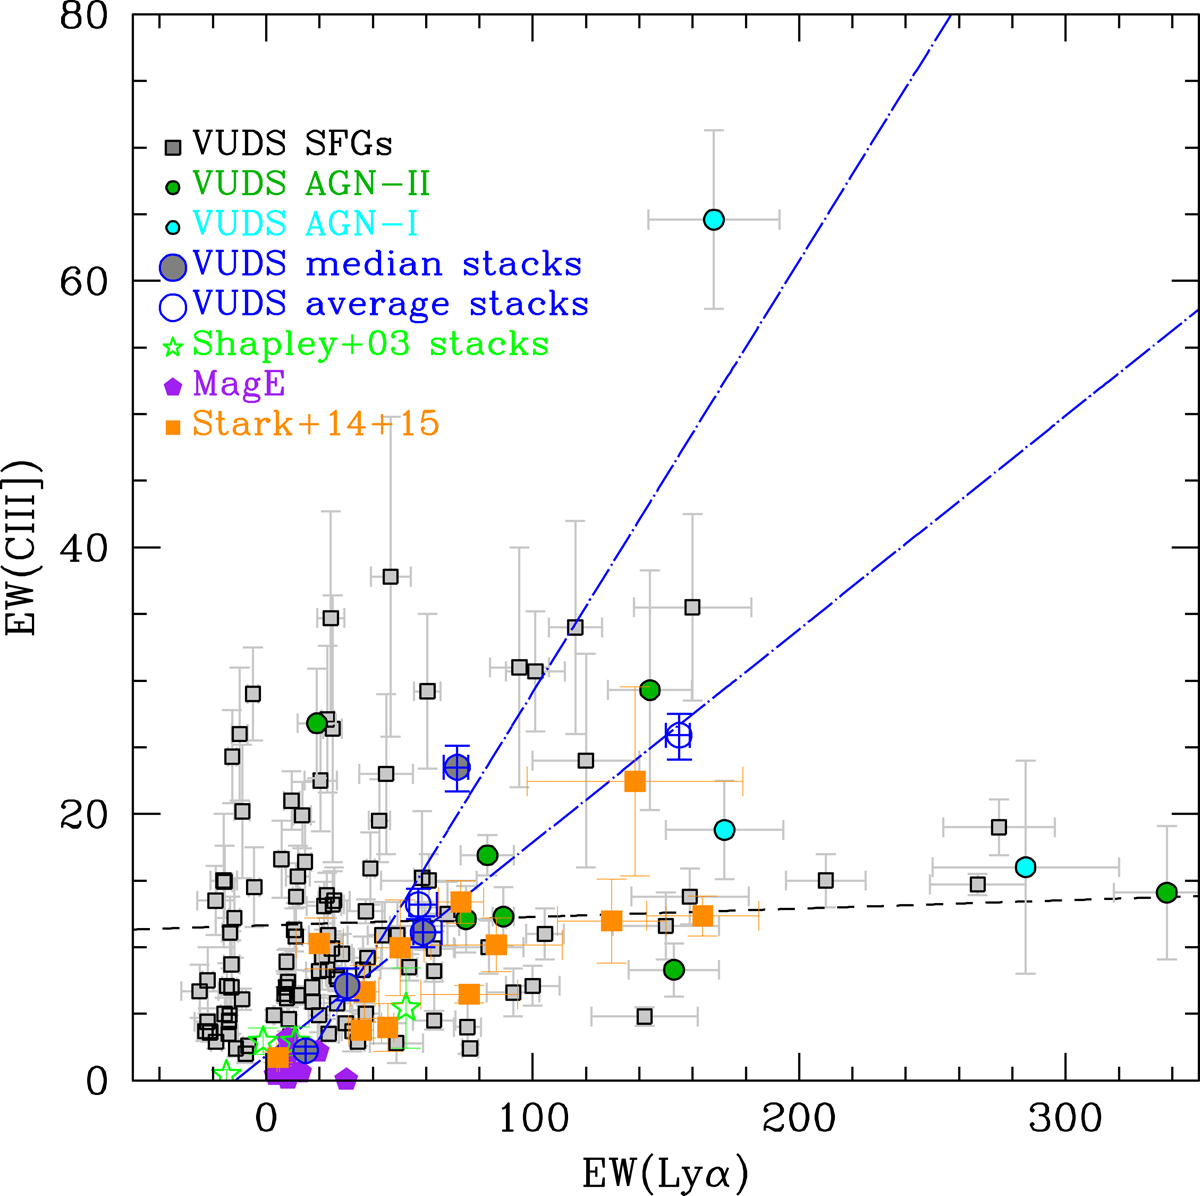
Rest-frame equivalent width of CIII]-λ1908 EW(CIII]) as a function of EW(Lyα). The least-squares fit to the individual data points (black squares) is represented by the black dashed line. The individual galaxies show only a weak correlation that is significant at about the 3σ level, with a large dispersion. Galaxies with strong Lyα and weak CIII] are observed, as well as galaxies with strong CIII] and Lyα in absorption. The EW(CIII]) vs. EW(Lyα) points for the median-stacked spectra of the different categories defined in Sect. 3 are indicated as blue circles filled with gray, while values for the average stacks in Table A.1 are indicated as open blue circles. The correlation between EW(CIII]) and EW(Lyα) appears to be very strong (rP = 0.99, rS = 1) and hides the wide range of properties of CIII] vs. Lyα. As a comparison with the literature, we plot the observed values from the different Lyα samples of Shapley et al. (2003) (green stars, average for Lyα samples), Rigby et al. (2015) (purple diamonds), and Stark et al. (2014, 2015) (orange squares).
Current usage metrics show cumulative count of Article Views (full-text article views including HTML views, PDF and ePub downloads, according to the available data) and Abstracts Views on Vision4Press platform.
Data correspond to usage on the plateform after 2015. The current usage metrics is available 48-96 hours after online publication and is updated daily on week days.
Initial download of the metrics may take a while.