Open Access
Fig. 12.
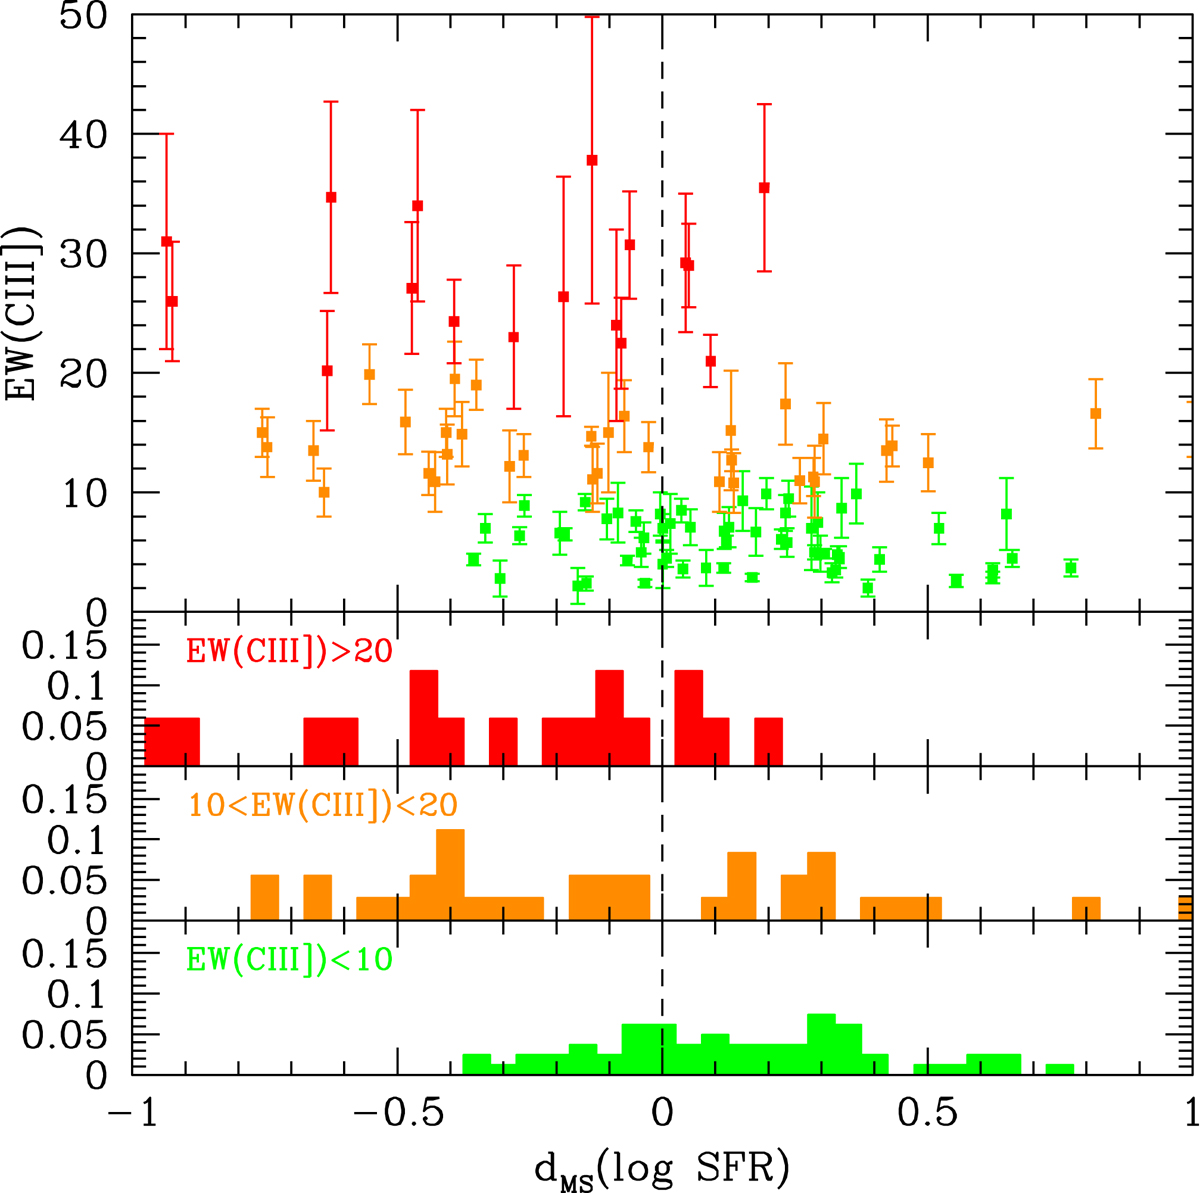
Bottom three panels: distribution of distances in SFR from the main sequence for CIII] emitters with increasing EW(CIII]), and top panel: distance to the main sequence for individual CIII] emitters. As EW(CIII]) increases, the distance to the main sequence increases.
Current usage metrics show cumulative count of Article Views (full-text article views including HTML views, PDF and ePub downloads, according to the available data) and Abstracts Views on Vision4Press platform.
Data correspond to usage on the plateform after 2015. The current usage metrics is available 48-96 hours after online publication and is updated daily on week days.
Initial download of the metrics may take a while.