Fig. 11.
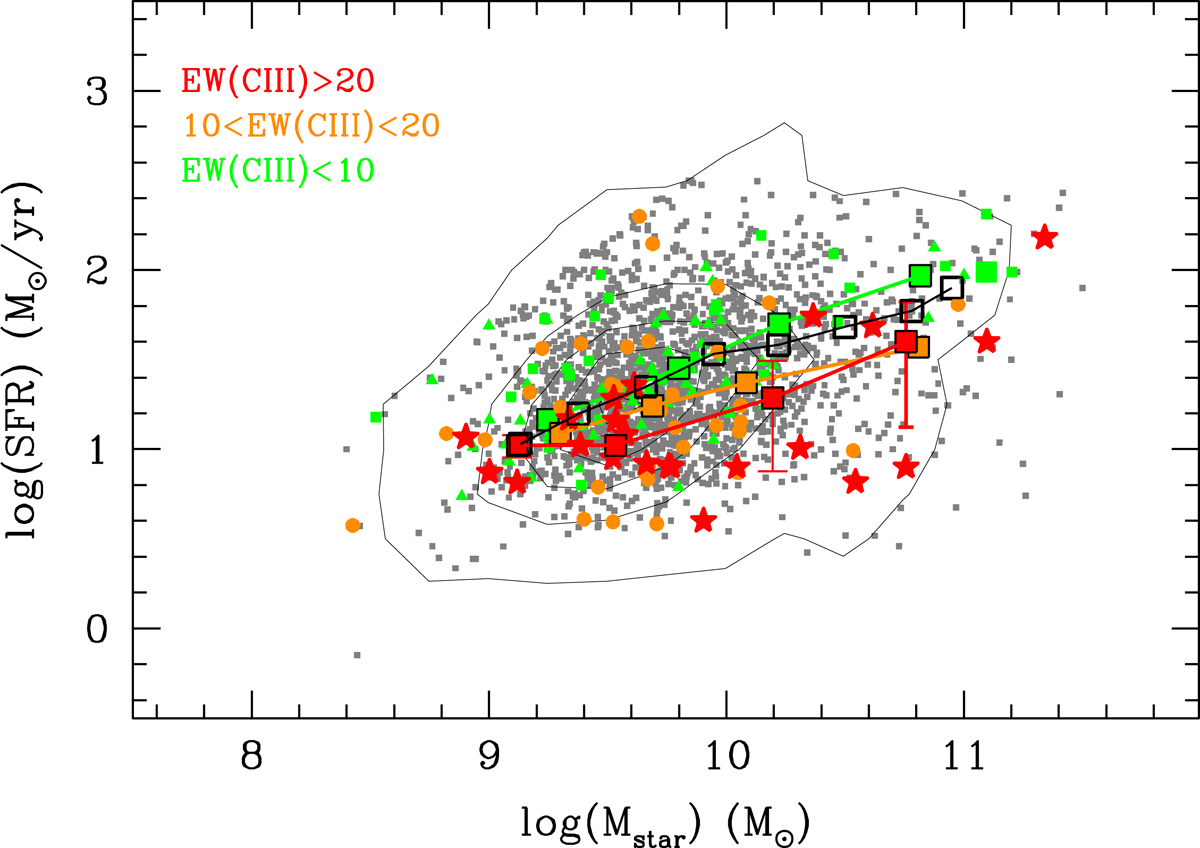
Distribution of CIII] emitters with different EW(CIII]) in the Mstar–SFR plane. The CIII] emitters with different EW are identified by the differently colored symbols. The parent sample of star-forming galaxies at redshifts 2 < z < 3.8 in VUDS is identified as gray symbols whose distribution is identified by the contours, and the main sequence of VUDS galaxies at z ∼ 3 is indicated by black open squares that are connected by a thick line. We note that both the strong and very strong CIII] emitters are on average below the MS, with median values identified by the connected orange and red squares, respectively. The lower SFR of these strong CIII] emitters compared to the MS is possibly caused by a strong star formation quenching produced by AGN feedback in the host star-forming galaxies.
Current usage metrics show cumulative count of Article Views (full-text article views including HTML views, PDF and ePub downloads, according to the available data) and Abstracts Views on Vision4Press platform.
Data correspond to usage on the plateform after 2015. The current usage metrics is available 48-96 hours after online publication and is updated daily on week days.
Initial download of the metrics may take a while.