Fig. 14.
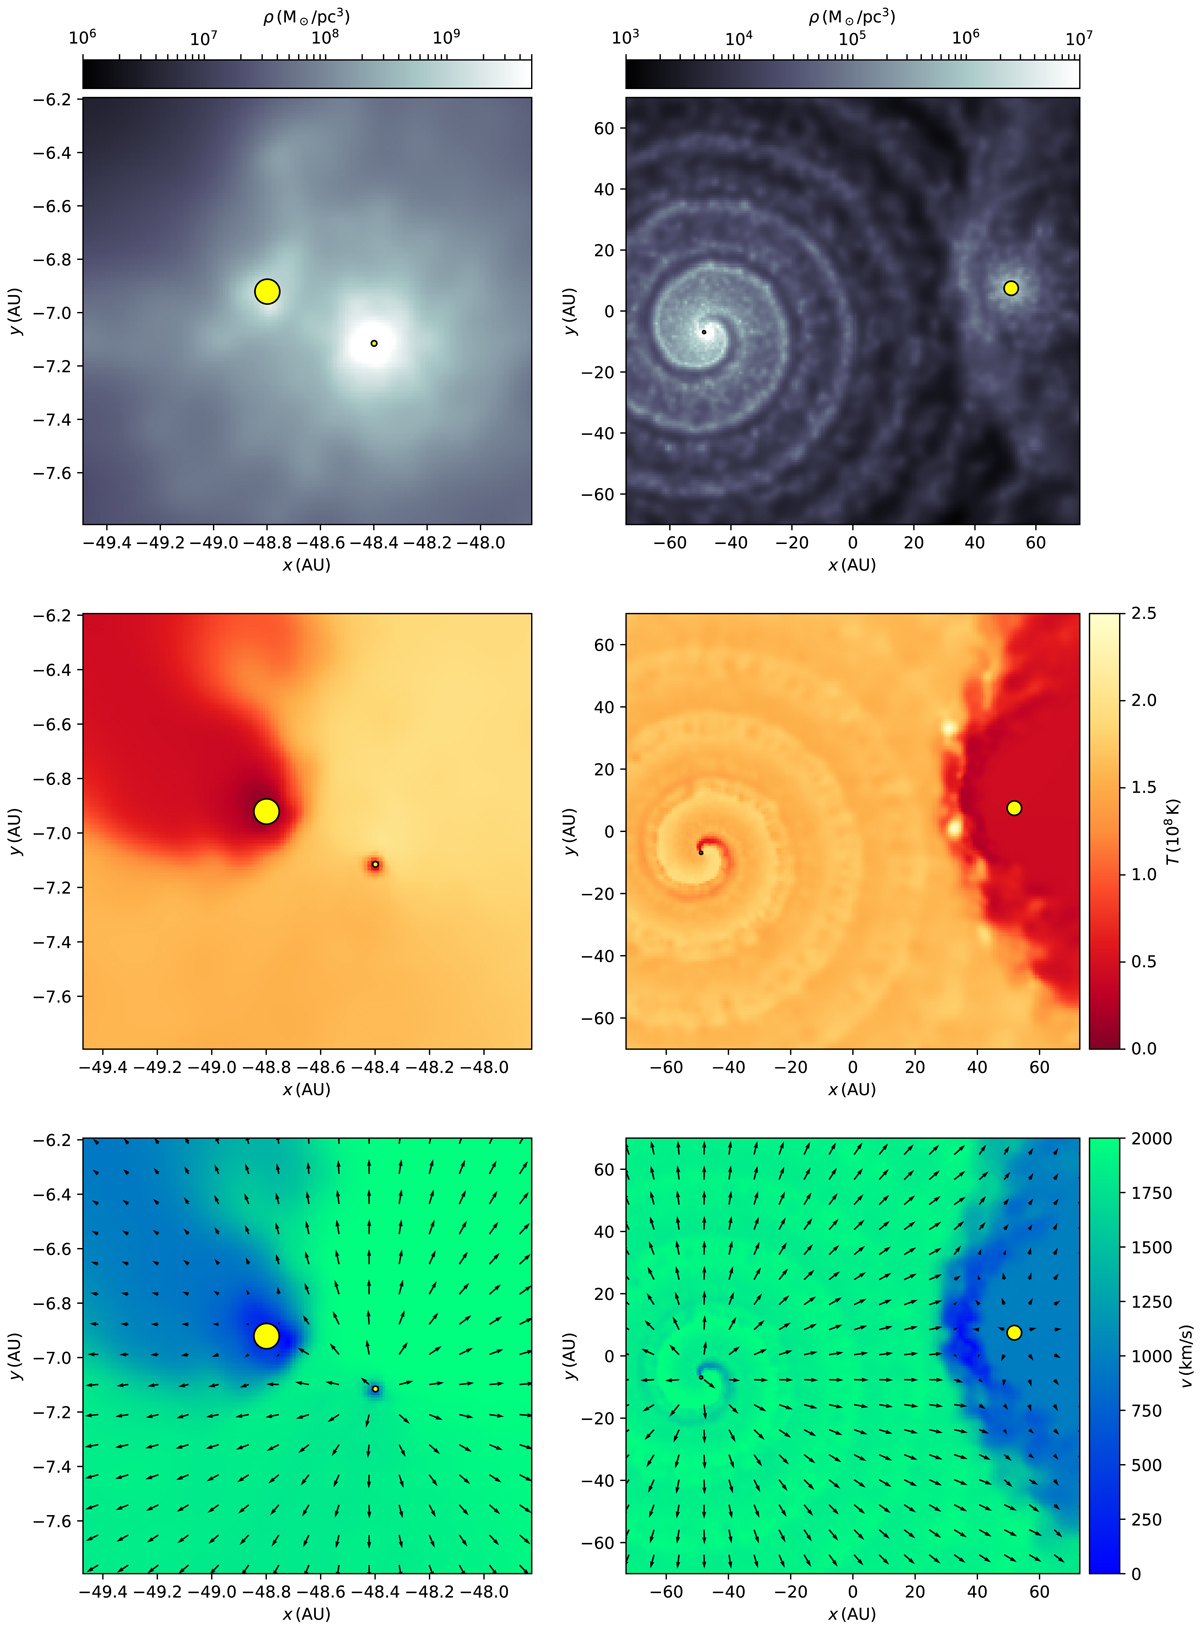
Gas density (top), temperature (center) and velocity (bottom) in the orbital plane of the colliding wind triple simulation for the inner (left) and outer (right) binary. The sizes of the stars (yellow circles) in the plots on the right hand panels were multiplied by 10 to make them visible. Left hand panels: Wolf-Rayet star (star 1, see Table 6) can be seen on the right and star 2 on the left. Right hand panels: the short period binary (star 1 and 2), can be seen on the left and the O9.5 supergiant (star 3) on the right. In the bottom plots, the arrows indicate the wind direction and larger arrows correspond to higher wind velocities, however, the colors provide a more precise indication of the velocities. Note that the two density plots have separate color bars, while the temperature and velocity plots each share a single color bar.
Current usage metrics show cumulative count of Article Views (full-text article views including HTML views, PDF and ePub downloads, according to the available data) and Abstracts Views on Vision4Press platform.
Data correspond to usage on the plateform after 2015. The current usage metrics is available 48-96 hours after online publication and is updated daily on week days.
Initial download of the metrics may take a while.