Fig. 11.
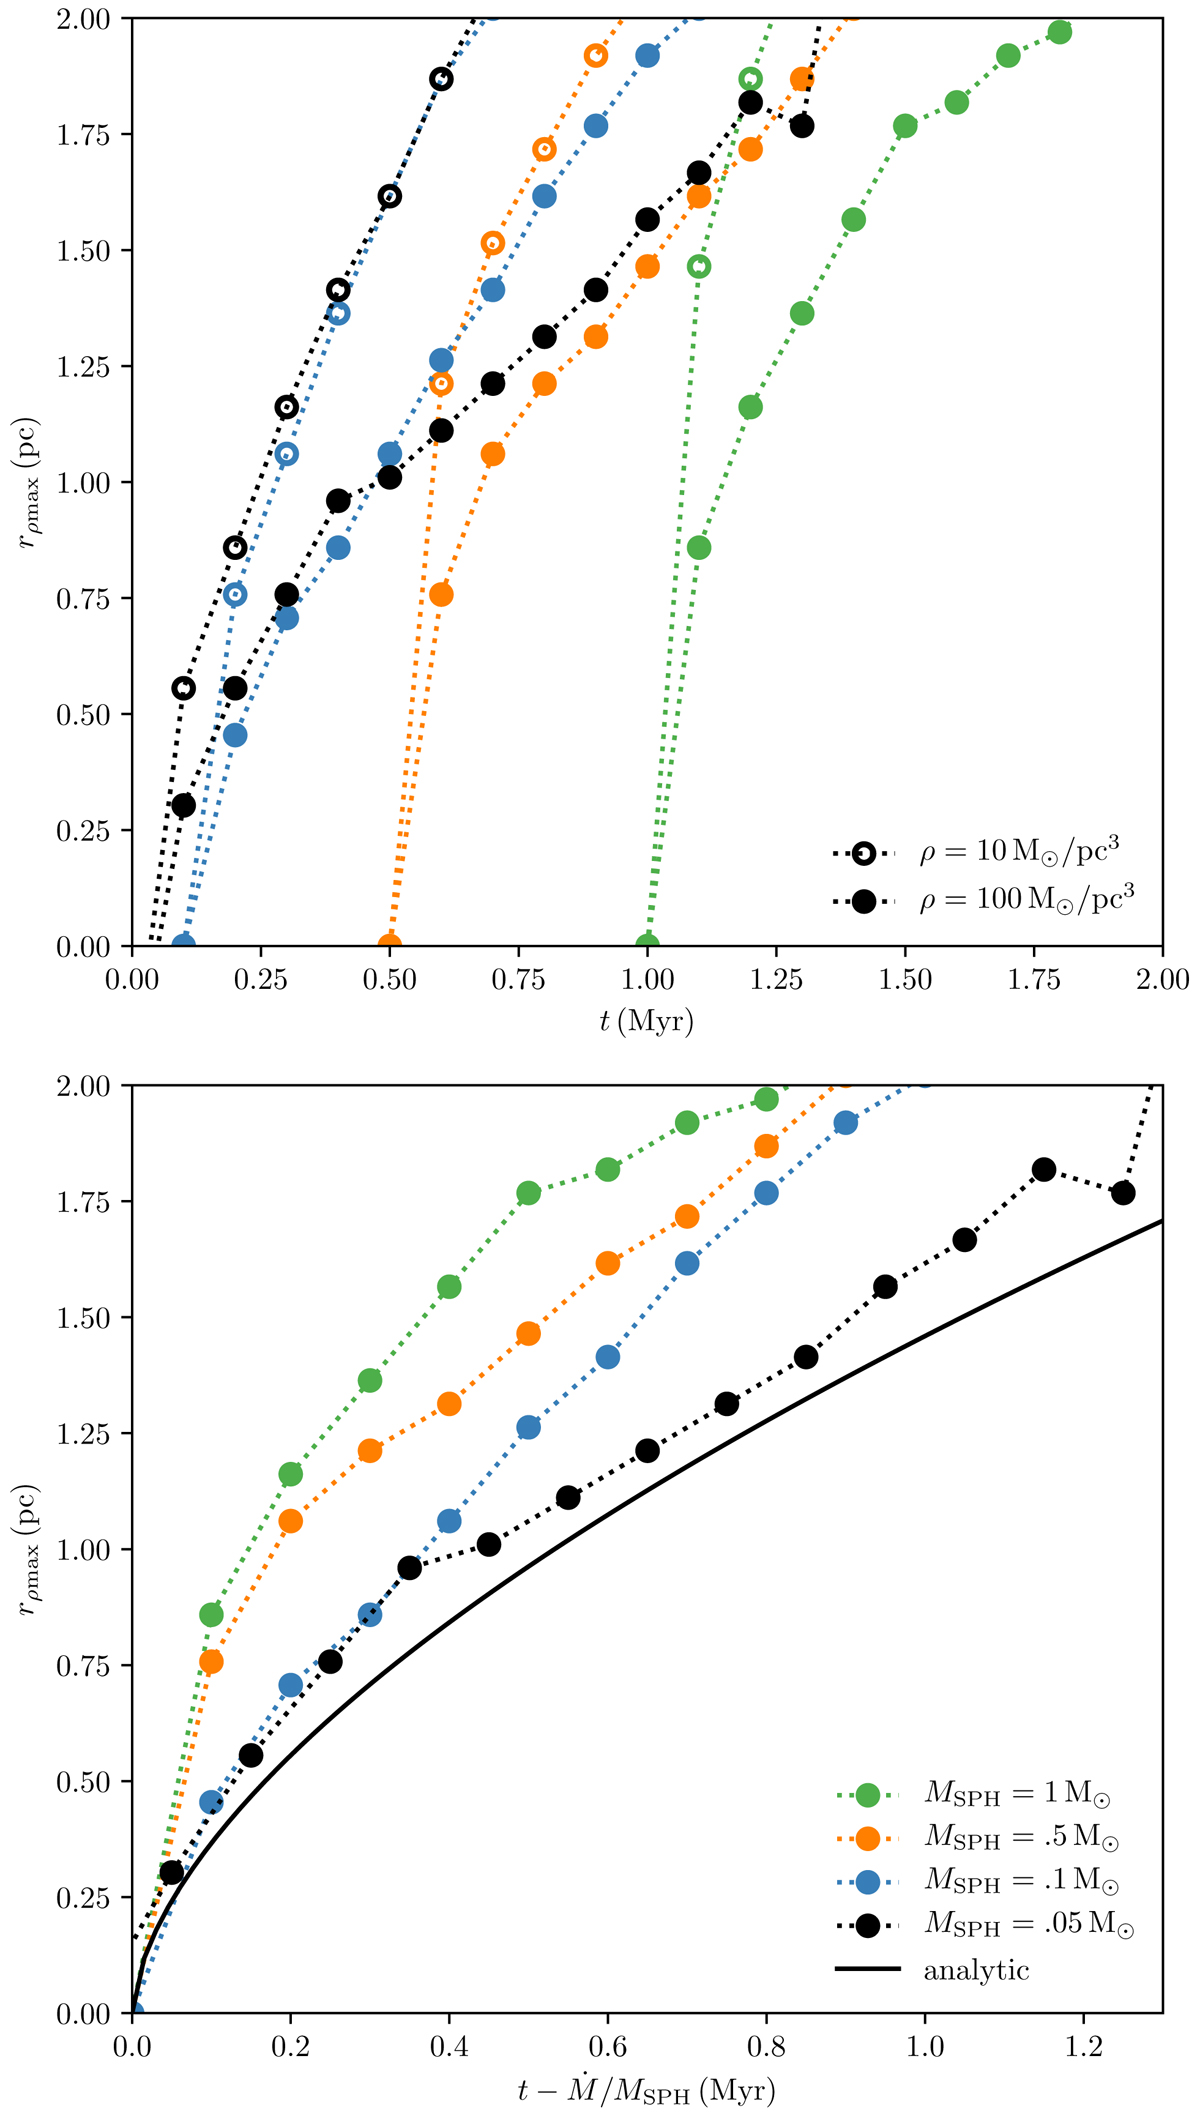
Radius with the highest mean gas density (rρmax) as a function of time, t for the embedded star simulations. Different colours correspond to different resolutions resulting from different SPH particle masses (MSPH). Top panel: rρmax for all simulations as a function of t. Lines with open circles correspond to simulations where the gas density, ρgas = 10 M⊙ pc−3 and lines with filled circles to simulations with a gas density, ρgas = 100 M⊙ pc−3. Bottom panel: simulations with ρgas = 100 M⊙ pc−3 and subtract Ṁ/MSPH (the time of the first SPH particle creation) from t. The black solid line shows the analytical solution for the shell radius of an energy driven flow in a constant density medium (Dyson 1984).
Current usage metrics show cumulative count of Article Views (full-text article views including HTML views, PDF and ePub downloads, according to the available data) and Abstracts Views on Vision4Press platform.
Data correspond to usage on the plateform after 2015. The current usage metrics is available 48-96 hours after online publication and is updated daily on week days.
Initial download of the metrics may take a while.