Free Access
Fig. 10.
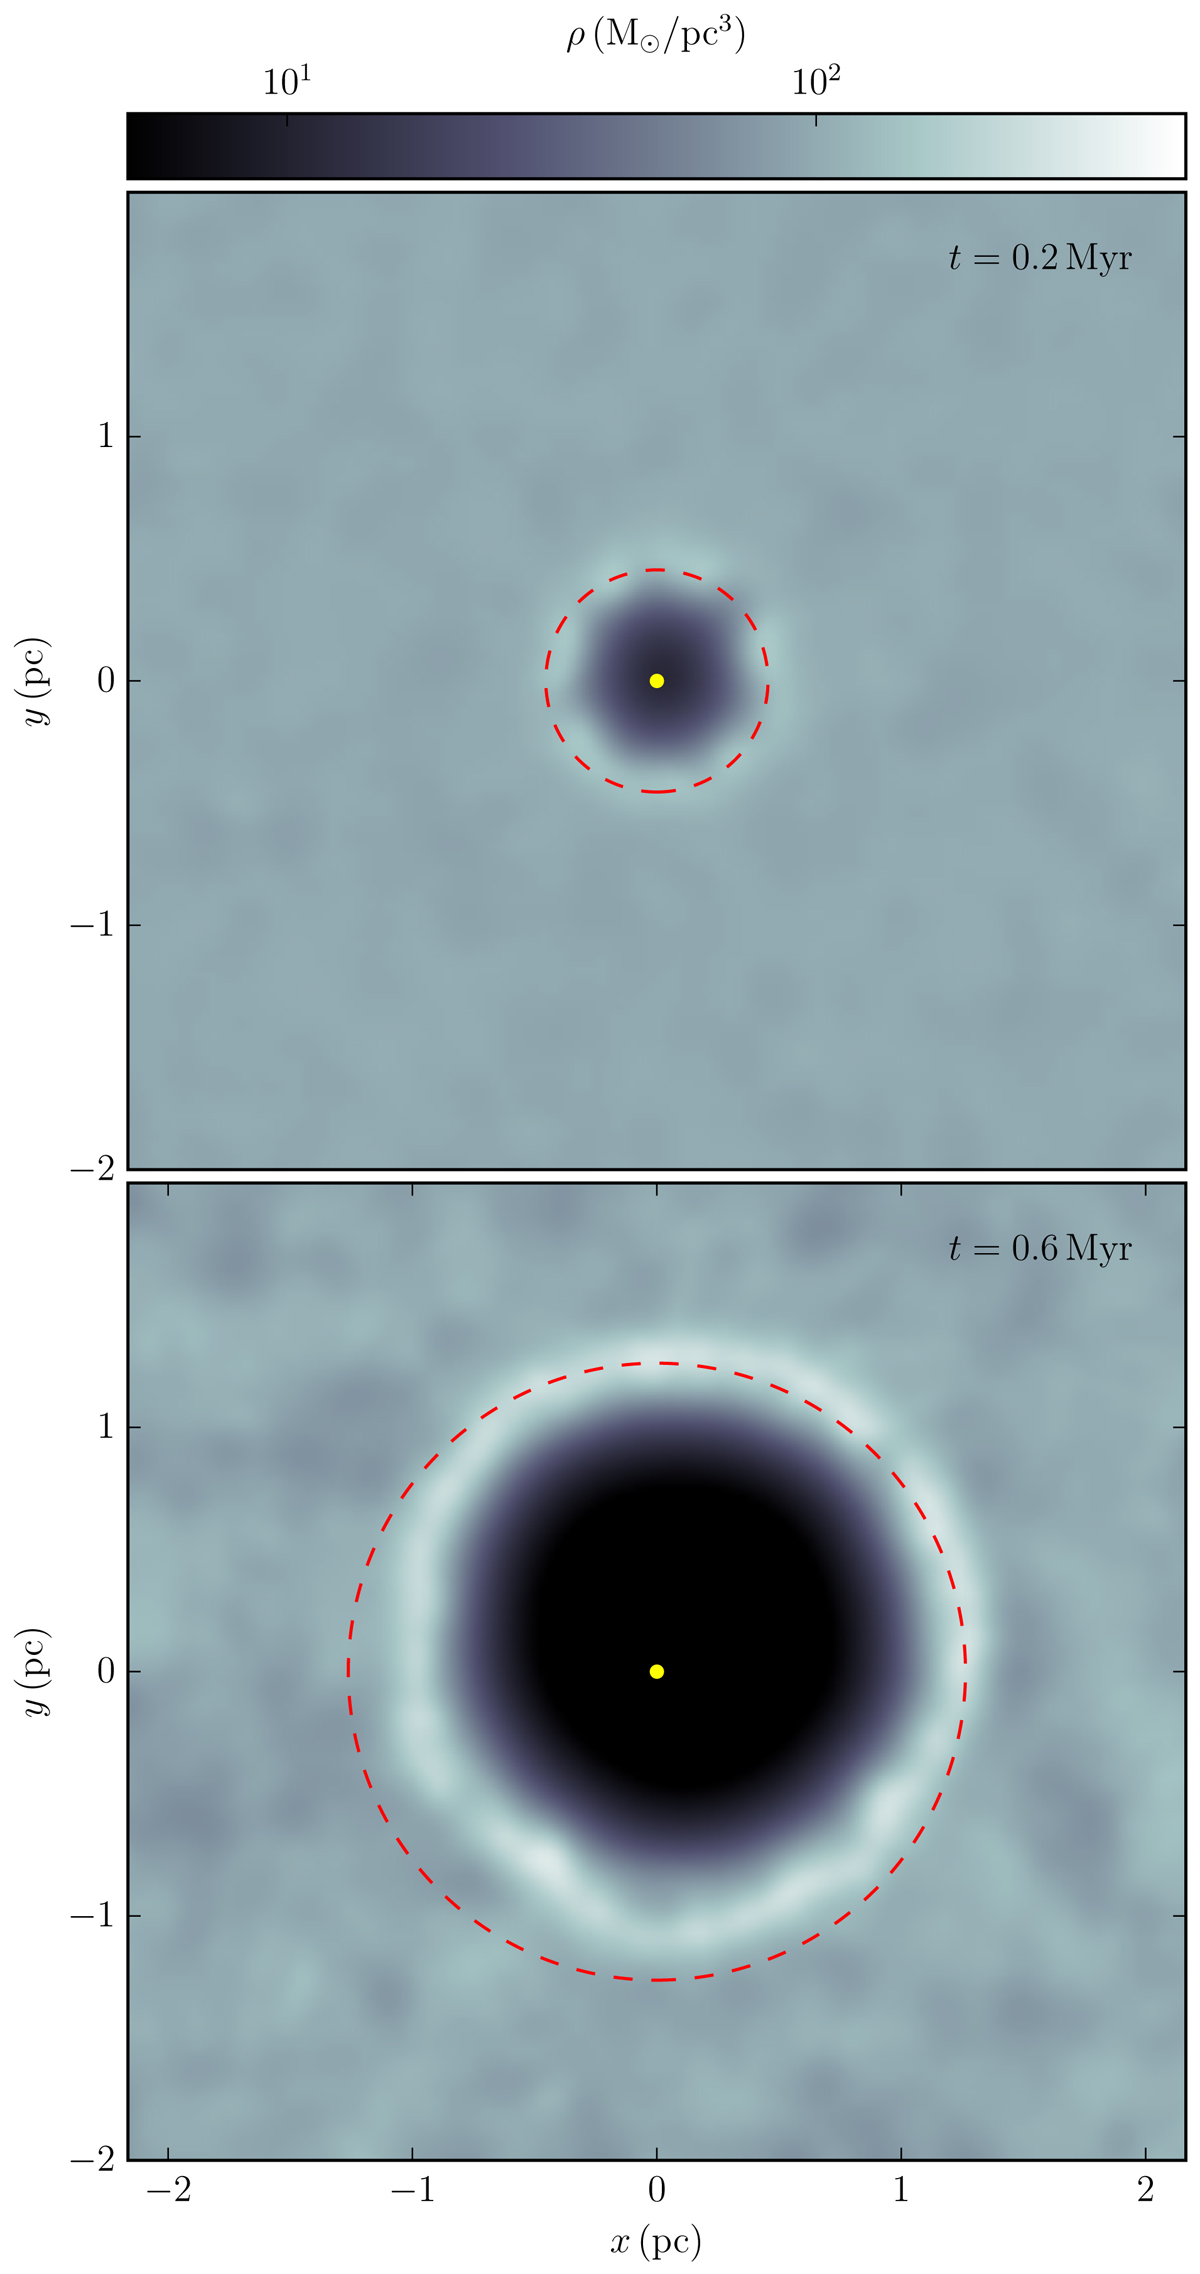
Gas density in the x − y plane after 0.2 Myr (top) and after 0.6 Myr (bottom) for the embedded star simulation with MSPH = 0.1 M⊙ and ρgas = 100 M⊙ pc−3. The embedded star is positioned at the origin (yellow dot) and the red dashed circle shows the radius with the largest mean density.
Current usage metrics show cumulative count of Article Views (full-text article views including HTML views, PDF and ePub downloads, according to the available data) and Abstracts Views on Vision4Press platform.
Data correspond to usage on the plateform after 2015. The current usage metrics is available 48-96 hours after online publication and is updated daily on week days.
Initial download of the metrics may take a while.