Fig. 1.
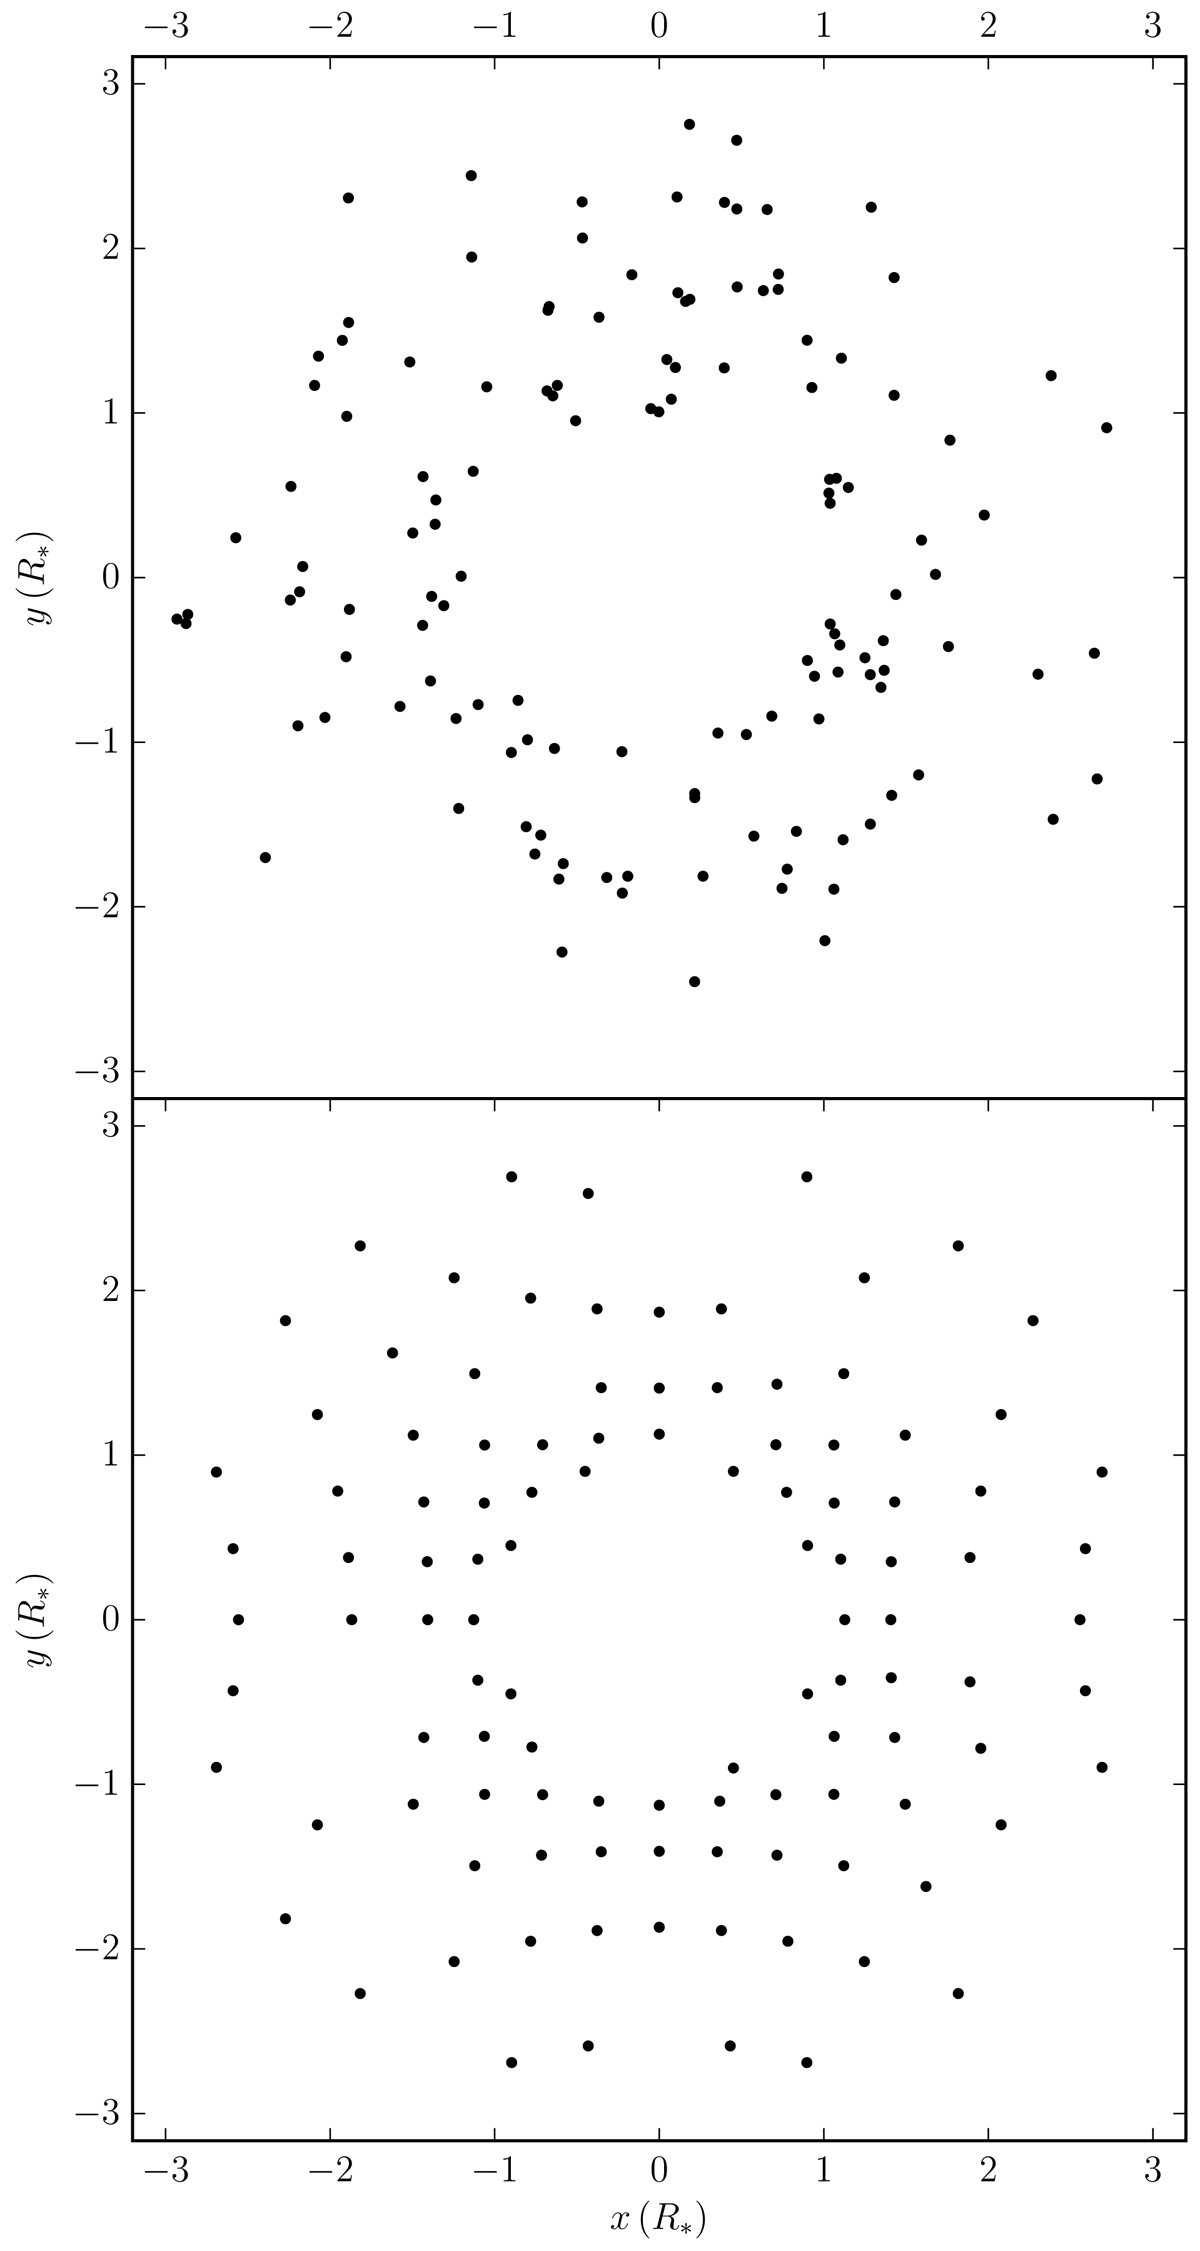
Example of the initial positions of newly created particles using a random (top) and grid (bottom) distribution. A shell of particles was created between 1 and 3 stellar radii (R*) and the x and y positions of a thin slice (|z| < 0.05 R*) are shown. The positions are scaled to match the given density profile (see Appendix A). Note that this is merely an illustration of the difference between random and grid initial distributions. In real simulations, the shells would generally be much thinner.
Current usage metrics show cumulative count of Article Views (full-text article views including HTML views, PDF and ePub downloads, according to the available data) and Abstracts Views on Vision4Press platform.
Data correspond to usage on the plateform after 2015. The current usage metrics is available 48-96 hours after online publication and is updated daily on week days.
Initial download of the metrics may take a while.