Fig. 5
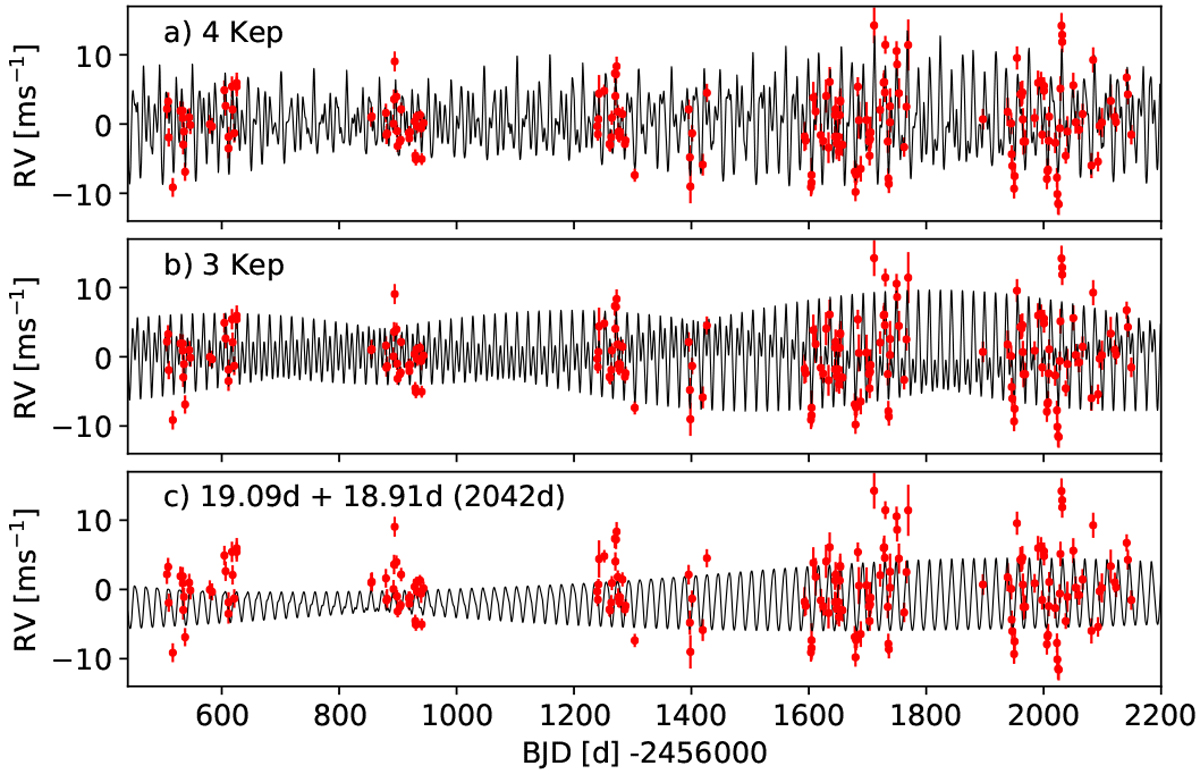
Four Keplerian best-fit models including all signals (periods of 9.4, 13.9, 18.9, and 19.1 d; top panel), the three signals connected to the stellar rotation (9.4, 18.9, and 19.1 d; middle panel), and the two signals around 19 d (bottom panel), resulting in the amplitude variation following the beat frequency of 2042 d in the observed time span. The red dots are the HARPS-N S2 to S6 and CARMENES data points.
Current usage metrics show cumulative count of Article Views (full-text article views including HTML views, PDF and ePub downloads, according to the available data) and Abstracts Views on Vision4Press platform.
Data correspond to usage on the plateform after 2015. The current usage metrics is available 48-96 hours after online publication and is updated daily on week days.
Initial download of the metrics may take a while.