Fig. 4
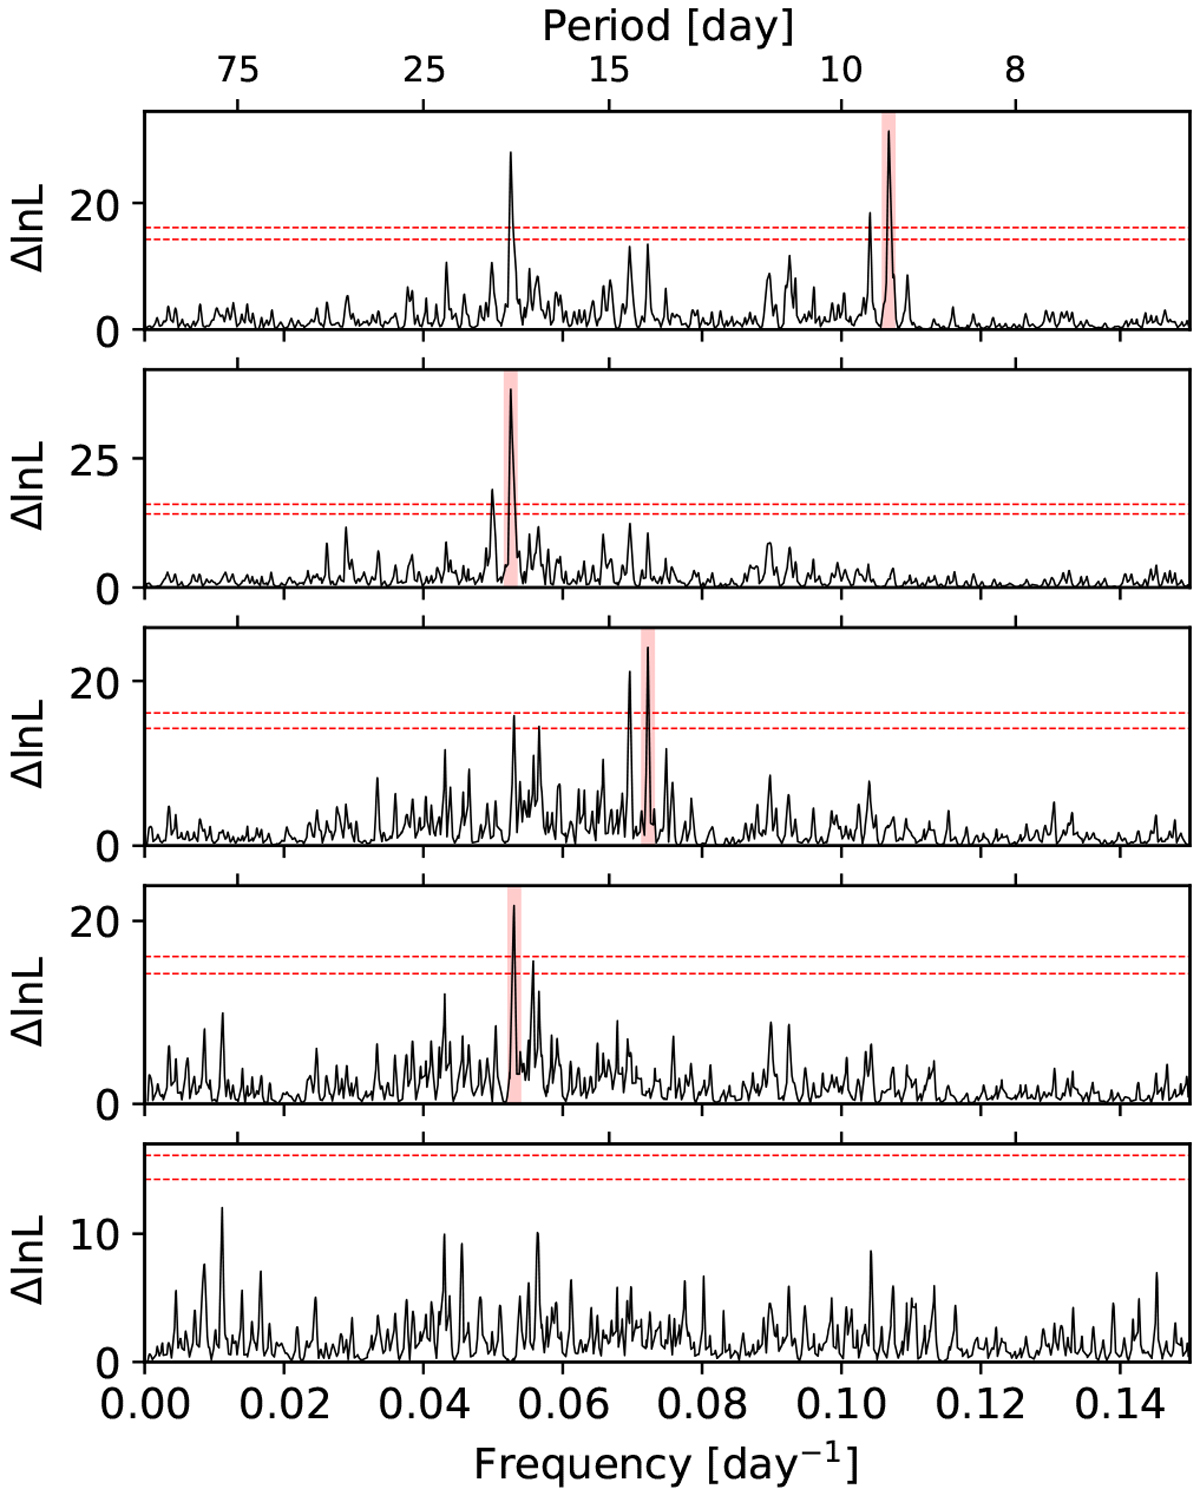
Region of interest of the Δ ln L periodograms of the combined RV datasets of Gl 49 (HARPS-N S2-S6 and CARMENES). Top panel: difference in ln L from a linear null model including additional jitters and offsets, to a model including one additional Keplerian (top panel). The following panel then shows the periodogram of the data with this Keplerian subtracted. From the second panel, from top to bottom: we have subtracted a best-fit Keplerian curve with periods of 9.37, 19.09, 13.85 and 18.91 d, as shown by the broad red vertical lines. The dashed horizontal red lines indicate the 0.1 and 1% FAP values calculated by bootstrap randomization using a single Keplerian model on the datasets (see Sect. 4.2)
Current usage metrics show cumulative count of Article Views (full-text article views including HTML views, PDF and ePub downloads, according to the available data) and Abstracts Views on Vision4Press platform.
Data correspond to usage on the plateform after 2015. The current usage metrics is available 48-96 hours after online publication and is updated daily on week days.
Initial download of the metrics may take a while.