Fig. 3
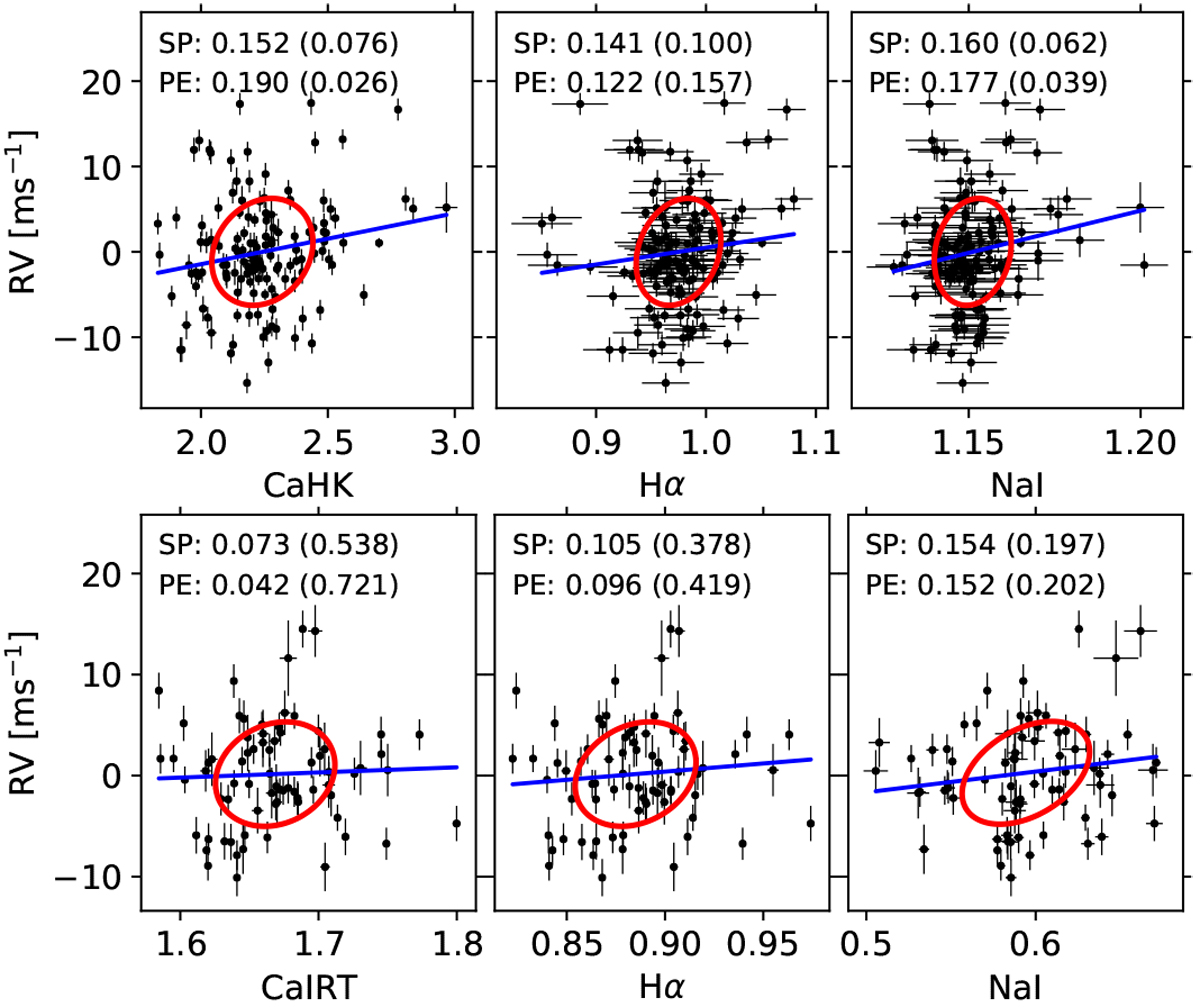
Correlations of the HARPS-N (top) and CARMENES (bottom) chromospheric line indices with the RV data. The red ellipses show the theoretical phase-shifted correlation using the phase shifts of periodicities of 19.11 d (HARPS-N) and 18.92 d (CARMENES), respectively, and the rms of the data as the amplitude of the signal. The blue lines represent the best linear fit, i.e., the Spearman factor. At the top of each image, we show the Spearman (SP) and Pearson (PE) factors together with their respective p-values in parenthesis.
Current usage metrics show cumulative count of Article Views (full-text article views including HTML views, PDF and ePub downloads, according to the available data) and Abstracts Views on Vision4Press platform.
Data correspond to usage on the plateform after 2015. The current usage metrics is available 48-96 hours after online publication and is updated daily on week days.
Initial download of the metrics may take a while.