Fig. 4.
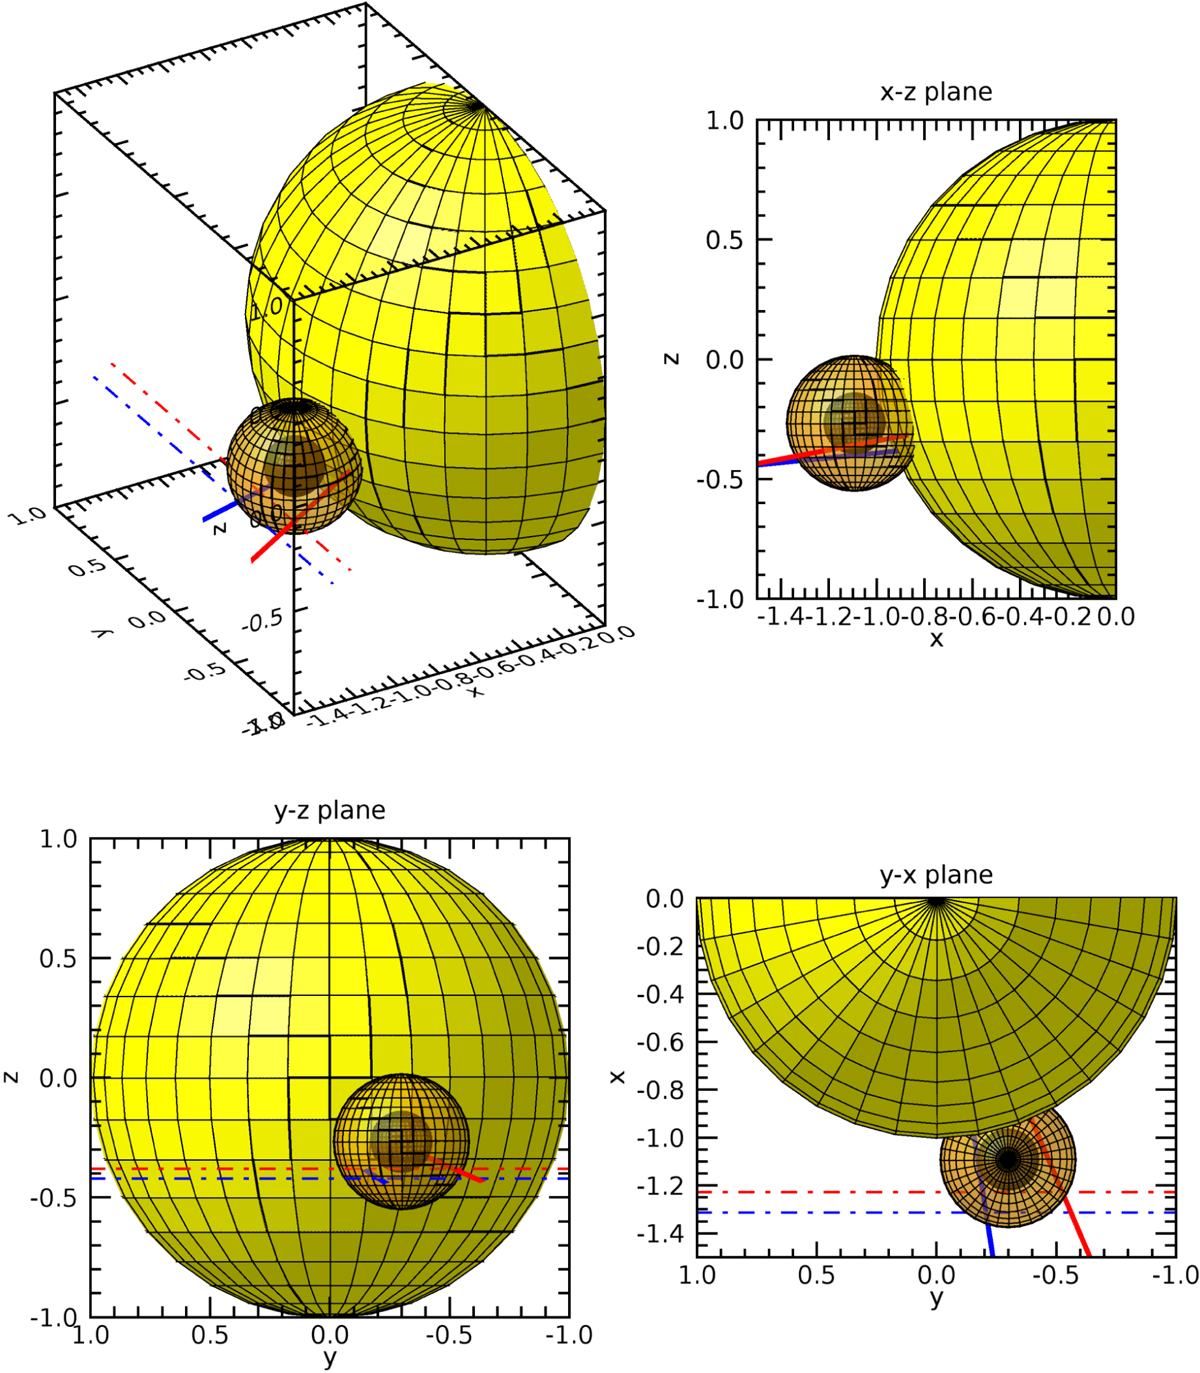
Three-dimensional model of the CME/shock surface (here shown at 13:09:30 UT). The x − z plane identifies the plane of the sky, where z is the north direction. The type II emission is supposed to be excited at the intersection of the spherical shock surface (identified by the light-brown sphere surrounding the dark-brown CME bubble) and the streamer axes. Blue and red straight lines identify the axes of the streamers and correspond, respectively, to type II emissions in the lower (L) and upper (U) branches of the splitted type II. Two lines of sight are depicted as red and blue lines with dots. The model explains the features observed by NRH at the various frequencies in Fig. 3.
Current usage metrics show cumulative count of Article Views (full-text article views including HTML views, PDF and ePub downloads, according to the available data) and Abstracts Views on Vision4Press platform.
Data correspond to usage on the plateform after 2015. The current usage metrics is available 48-96 hours after online publication and is updated daily on week days.
Initial download of the metrics may take a while.