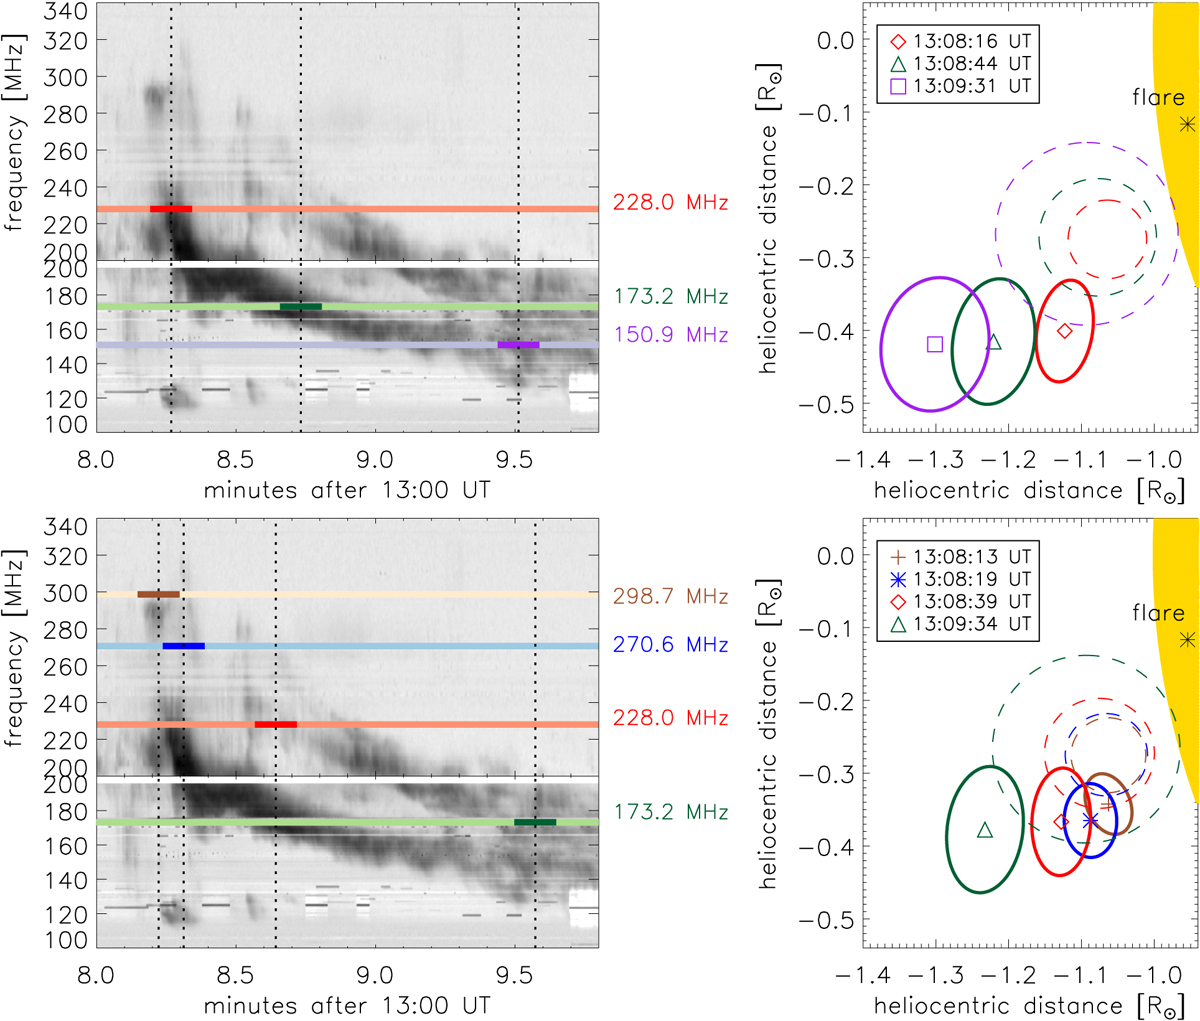
Fig. 3.

Left panels: combined mid (100−196 MHz) and high (200−340 MHz) dynamic spectra obtained by BIR CALLISTO receivers covering the high-frequency range of the type II event detected on 2014 October 30. Darker-colored lines show the time intervals over which the NRH data have been averaged at a given frequency. Right panels: locations of the centroids of 2D elliptical Gaussian fits (shown with 95% contour levels) to the type II sources observed by NRH (plotted with colors corresponding to the frequencies in the left panels). Dashed circles correspond to the corresponding EUV front locations.
Current usage metrics show cumulative count of Article Views (full-text article views including HTML views, PDF and ePub downloads, according to the available data) and Abstracts Views on Vision4Press platform.
Data correspond to usage on the plateform after 2015. The current usage metrics is available 48-96 hours after online publication and is updated daily on week days.
Initial download of the metrics may take a while.


