Fig. 2.
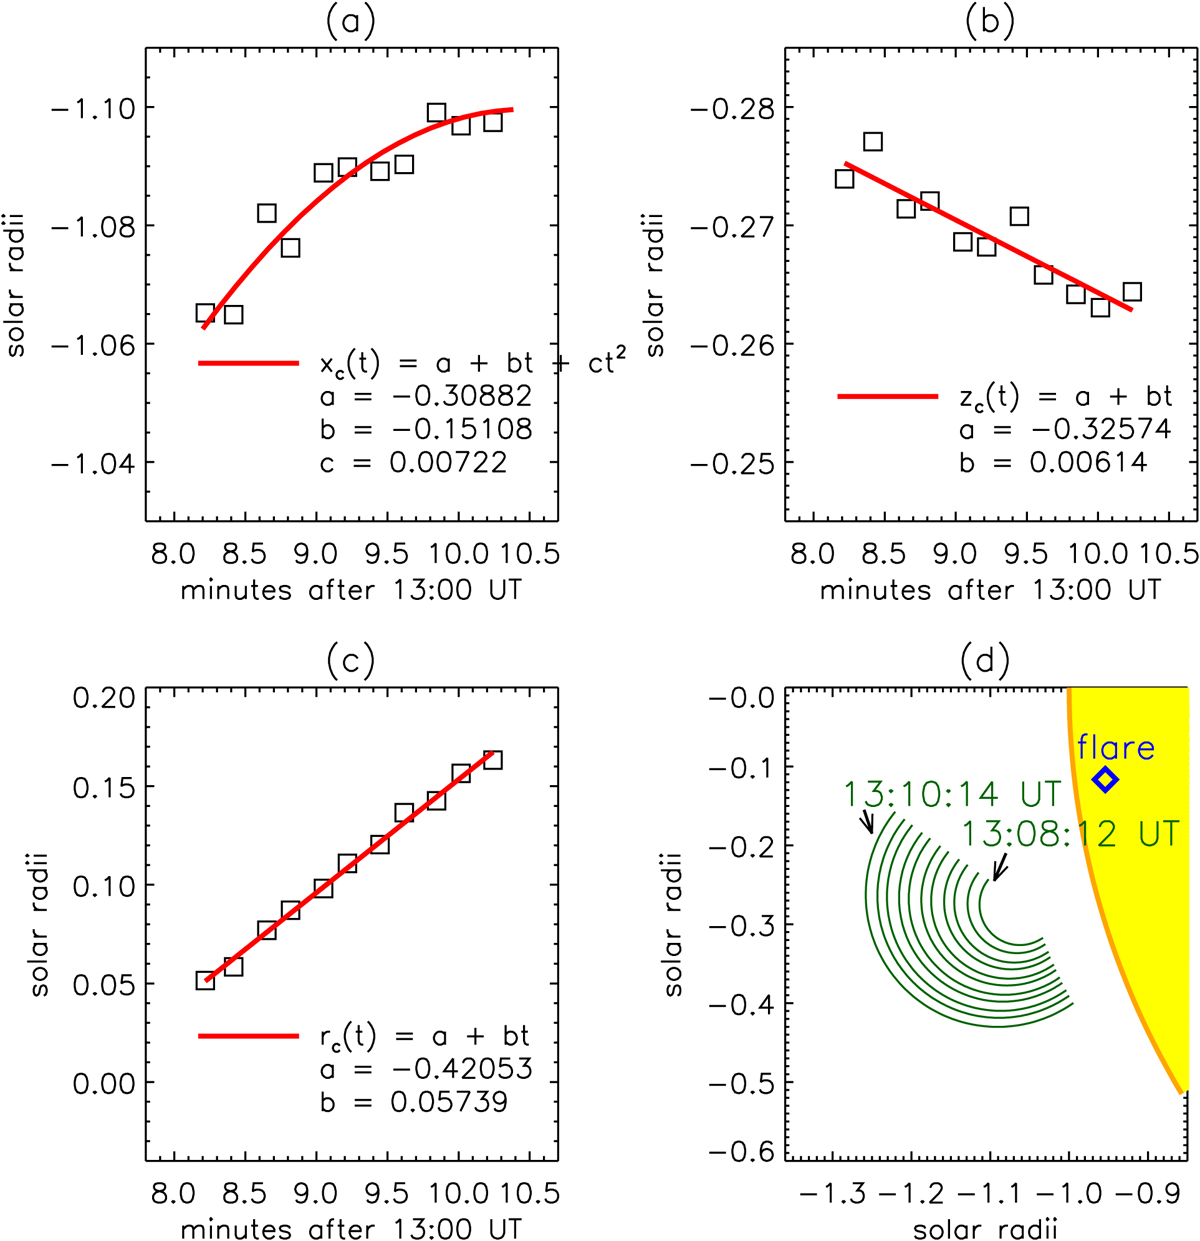
Quadratic fits to the temporal evolution of the three parameters xc (panel a), zc (panel b), and rcme (panel c) representing, respectively, the x and z coordinates in the plane of the sky x − z of the center and the radius of the circle (panel d) used to fit the bright expanding bubble observed by SDO/AIA between 13:08:12 UT and 13:10:14 UT.
Current usage metrics show cumulative count of Article Views (full-text article views including HTML views, PDF and ePub downloads, according to the available data) and Abstracts Views on Vision4Press platform.
Data correspond to usage on the plateform after 2015. The current usage metrics is available 48-96 hours after online publication and is updated daily on week days.
Initial download of the metrics may take a while.