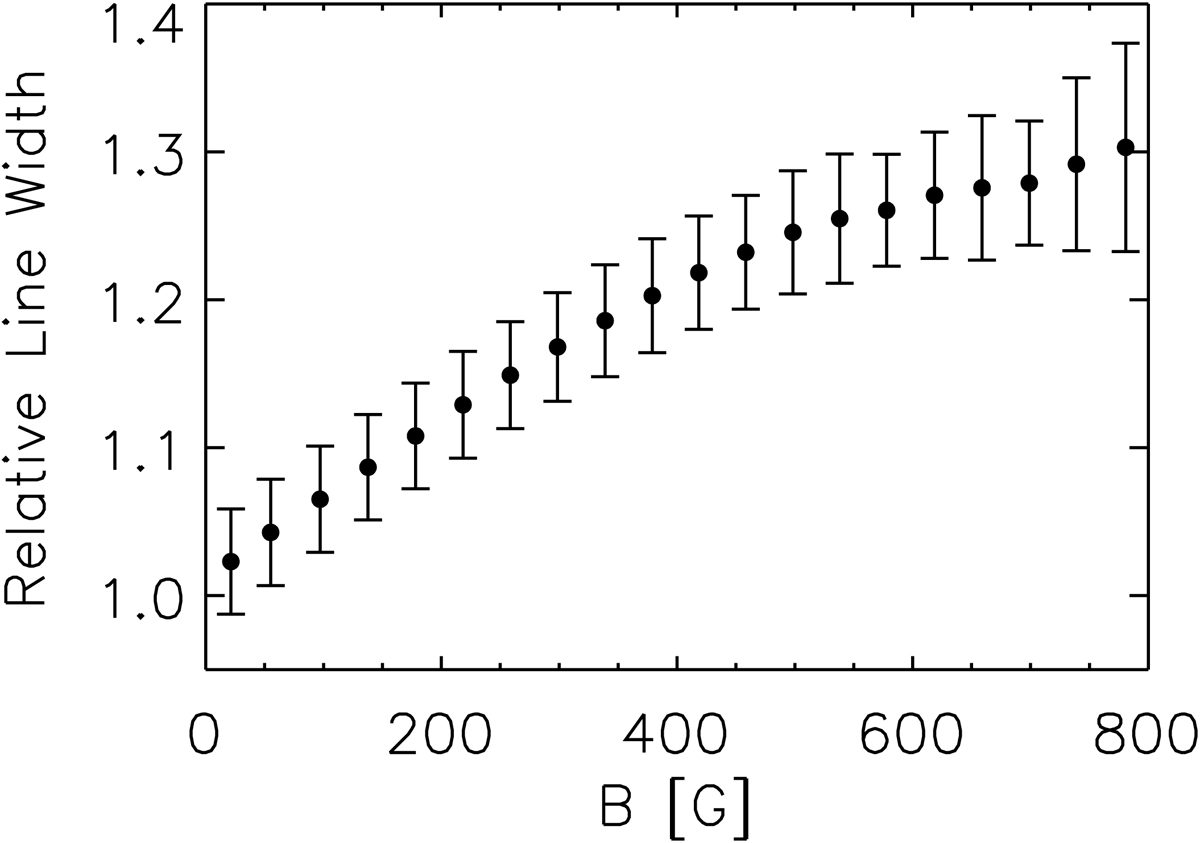
Fig. 4.

As a function of B, the width of the Fe I 6173 Å line, relative to the quiet-Sun level, about disc centre (0.94 < μ ≤ 1.00). The relative line width of network and faculae, which is essentially their contrast in the line width map, is derived in an analogous manner to the intensity contrast (Sect. 3.2). The filled circles and error bars have the same meaning as in Fig. 3.
Current usage metrics show cumulative count of Article Views (full-text article views including HTML views, PDF and ePub downloads, according to the available data) and Abstracts Views on Vision4Press platform.
Data correspond to usage on the plateform after 2015. The current usage metrics is available 48-96 hours after online publication and is updated daily on week days.
Initial download of the metrics may take a while.


