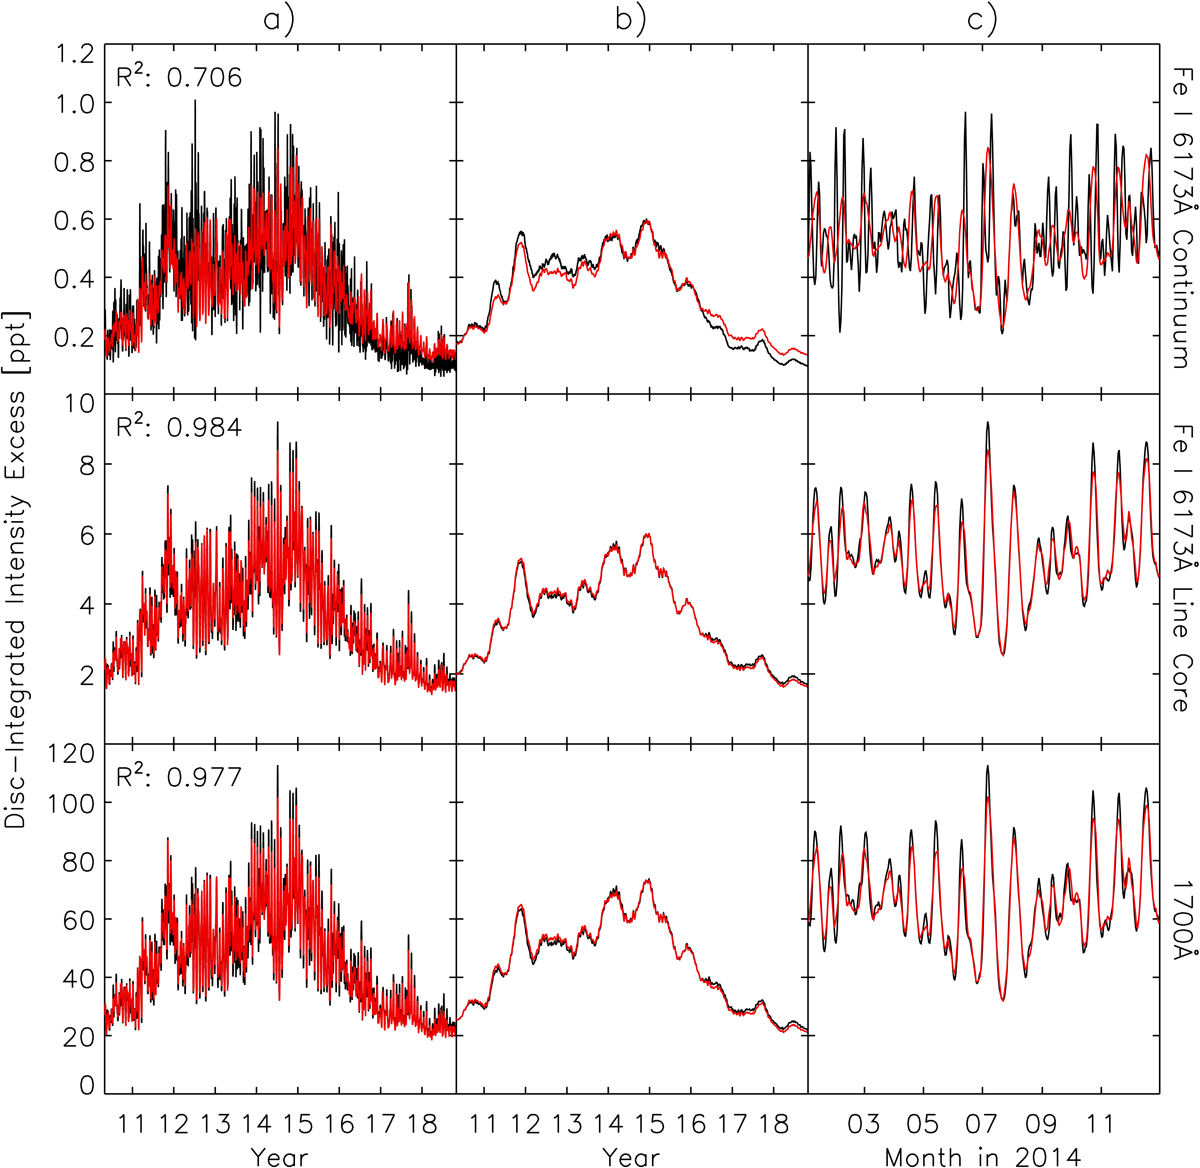
Fig. 14.

Panel a: black: daily disc-integrated intensity excess at the continuum and core of the Fe I 6173 Å line and 1700 Å (top to bottom), calculated with the empirical intensity contrast model derived in this study (Eq. (2) and Table 1). Red: fit of the daily disc-integrated intensity excess at the Ca II K line, calculated with the relationship between Ca II K intensity excess and Blos reported by Harvey & White (1999). The R2 between the two time series is annotated. Panel b: 81-day moving average. Panel c: zoomed inset of 2014.
Current usage metrics show cumulative count of Article Views (full-text article views including HTML views, PDF and ePub downloads, according to the available data) and Abstracts Views on Vision4Press platform.
Data correspond to usage on the plateform after 2015. The current usage metrics is available 48-96 hours after online publication and is updated daily on week days.
Initial download of the metrics may take a while.


