Fig. 5.
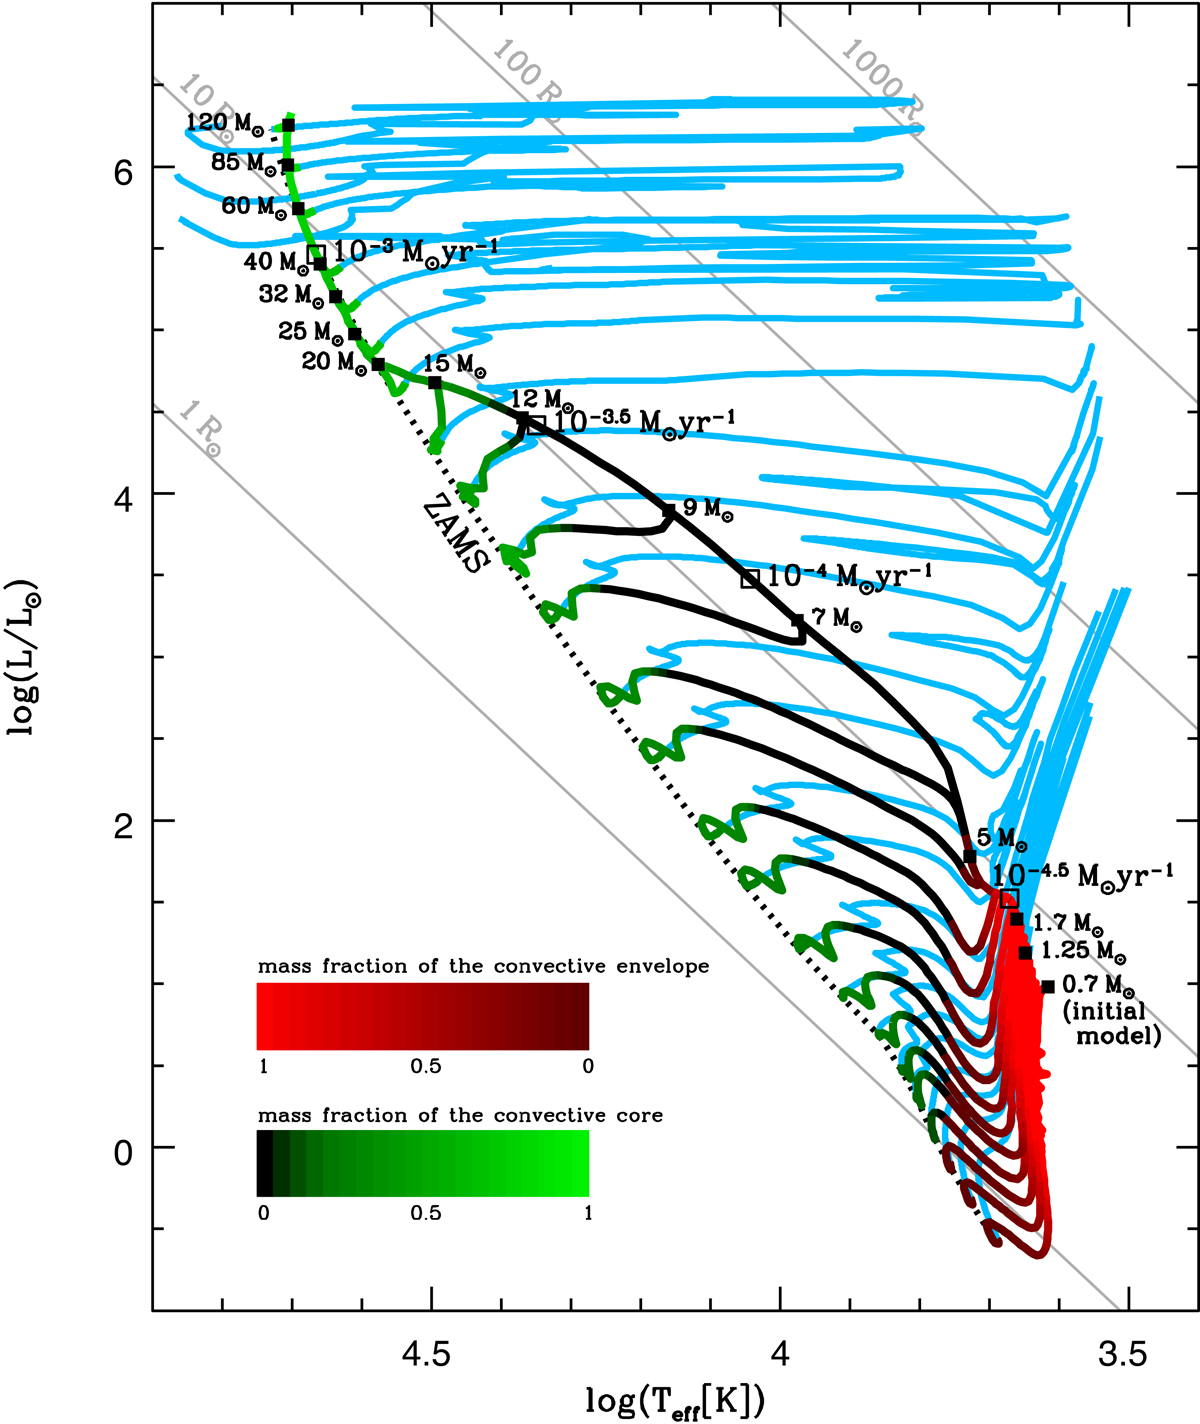
HR diagram of the models. The new tracks are plotted with a red-black-green colour gradient, with the indicated colour code: the mass fraction of the convective envelope is indicated in red, while that of the convective core is coloured in green. The black segments indicate fully radiative stars. The mass and accretion rate along the birthline are indicated at various stages. The blue curves are the non-rotating models of Ekström et al. (2012). The black dotted line is the ZAMS of Ekström et al. (2012). The grey straight lines are the iso-radii of the indicated radii.
Current usage metrics show cumulative count of Article Views (full-text article views including HTML views, PDF and ePub downloads, according to the available data) and Abstracts Views on Vision4Press platform.
Data correspond to usage on the plateform after 2015. The current usage metrics is available 48-96 hours after online publication and is updated daily on week days.
Initial download of the metrics may take a while.