Fig. 4.
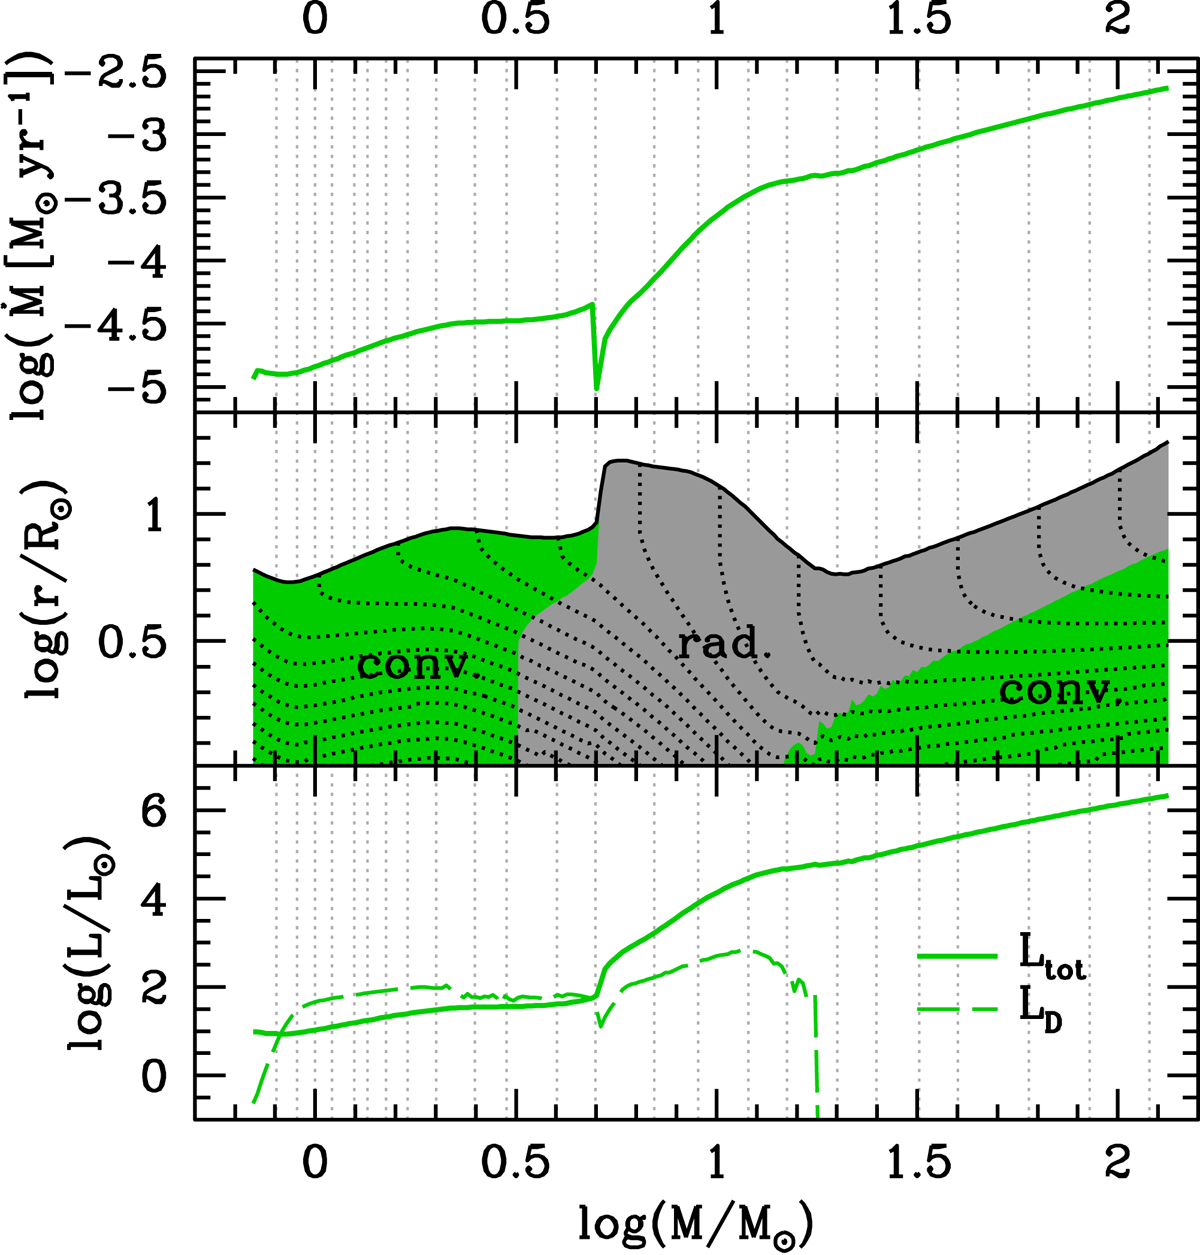
Accretion rate, internal structure, and luminosity as a function of the mass on the birthline. The vertical grey dotted straight lines indicate the masses M0 of the model of the grid (Sect. 2.5). Middle panel: the upper black curve is the photospheric radius, the green (resp. grey) areas are convective (resp. radiative) regions, and the black dotted curves are iso-mass (i.e. Lagrangian layers). Lower panel: the solid line is the total photospheric luminosity and the dashed one is the luminosity produced by D-burning.
Current usage metrics show cumulative count of Article Views (full-text article views including HTML views, PDF and ePub downloads, according to the available data) and Abstracts Views on Vision4Press platform.
Data correspond to usage on the plateform after 2015. The current usage metrics is available 48-96 hours after online publication and is updated daily on week days.
Initial download of the metrics may take a while.