Fig. 3.
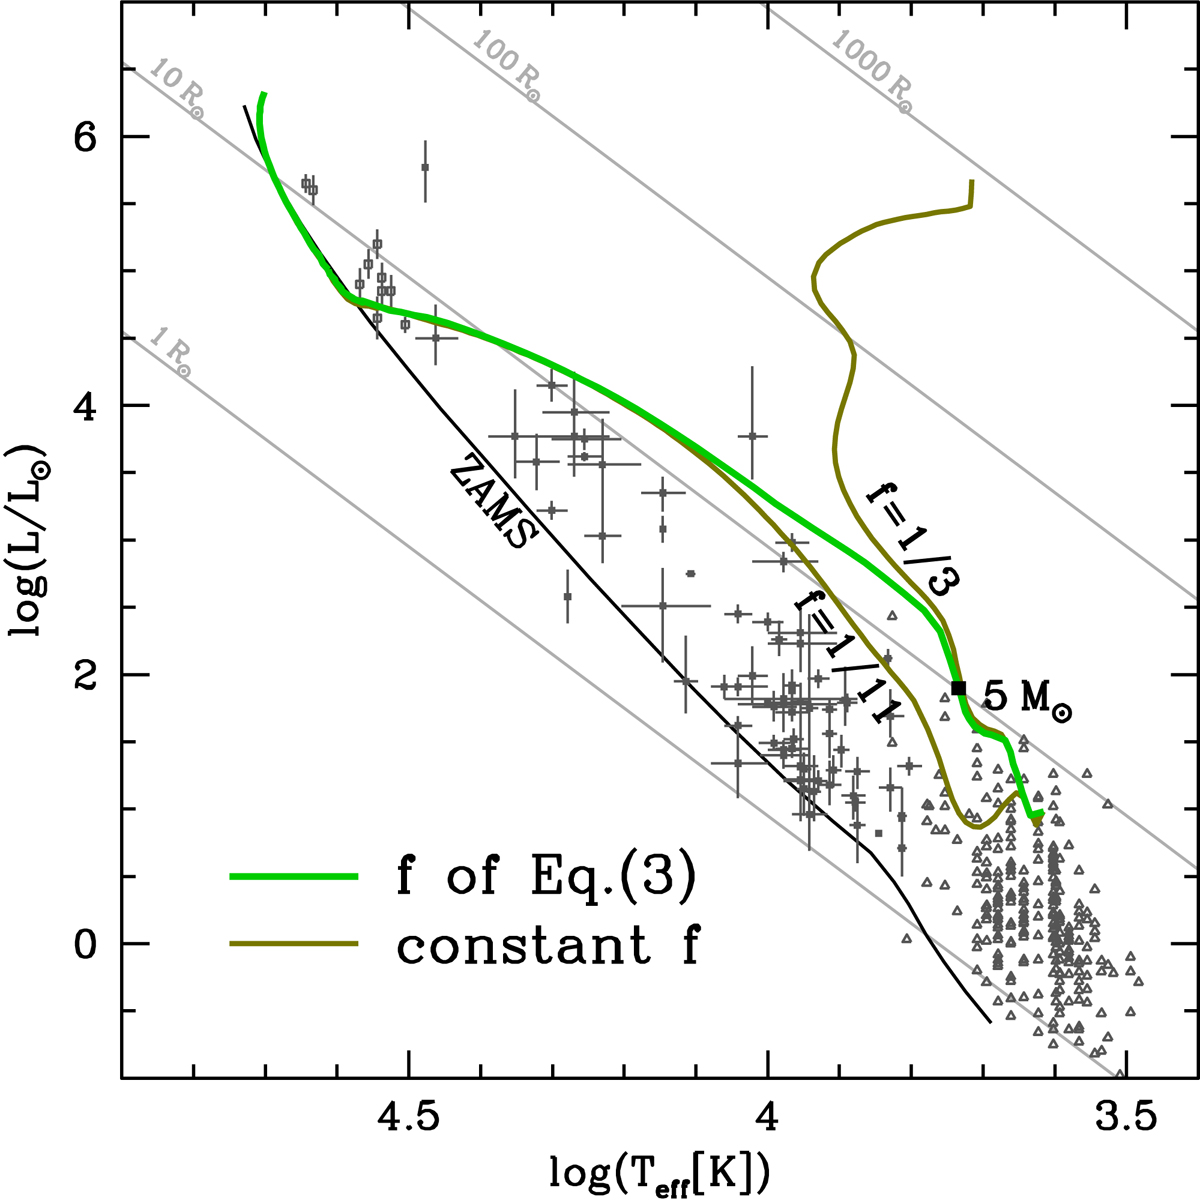
Theoretical birthlines for various values of f. The green track is the birthline used in the present grid, with f given by Eq. (3). The brown tracks are birthlines with constant f = 1/3 and 1/11, from Haemmerlé et al. (2016). The switching point of Eq. (3) is indicated by a black square. Other lines and points are identical to Fig. 1.
Current usage metrics show cumulative count of Article Views (full-text article views including HTML views, PDF and ePub downloads, according to the available data) and Abstracts Views on Vision4Press platform.
Data correspond to usage on the plateform after 2015. The current usage metrics is available 48-96 hours after online publication and is updated daily on week days.
Initial download of the metrics may take a while.