Free Access
Fig. 10.
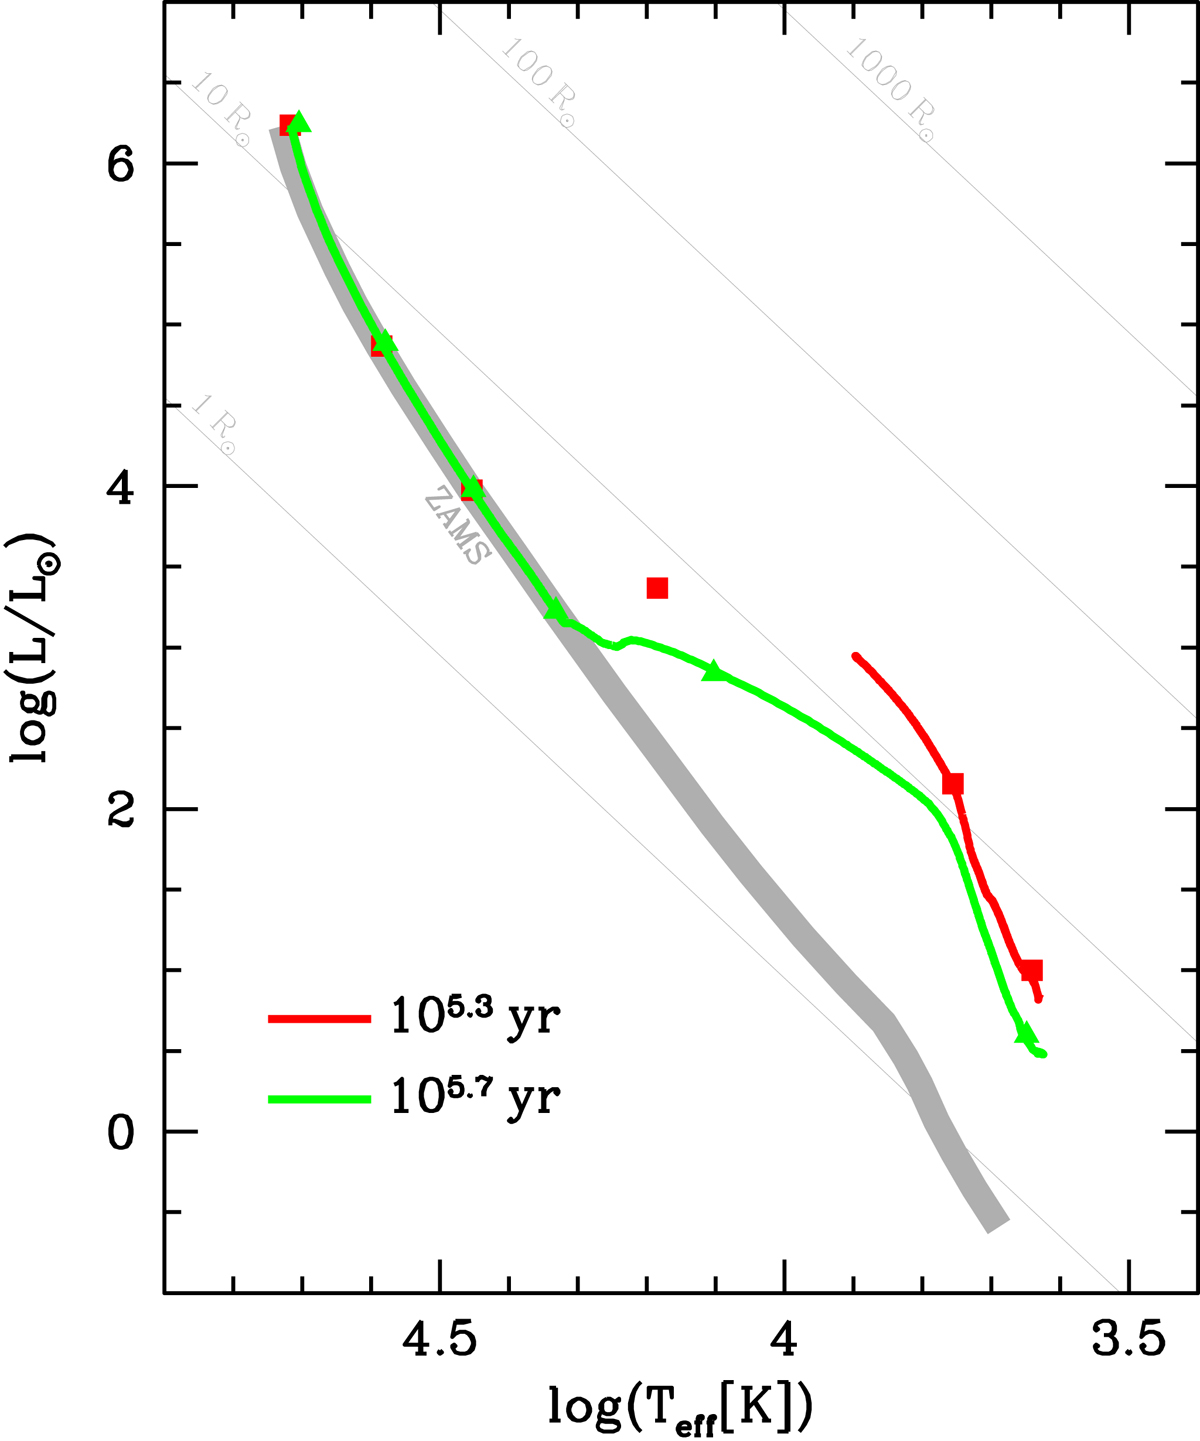
Isochrones of 105.3 yr ≃ 2 × 10⁵ yr and 105.7 yr ≃ 5 × 10⁵ yr for the two scenarios described in Sect. 4.2. Isochrones of scenario 1 are plotted with solid lines, while those of scenario 2 are shown by series of squares (105.3 yr) and triangles (105.7 yr). The colours of the lines and squares indicate the age.
Current usage metrics show cumulative count of Article Views (full-text article views including HTML views, PDF and ePub downloads, according to the available data) and Abstracts Views on Vision4Press platform.
Data correspond to usage on the plateform after 2015. The current usage metrics is available 48-96 hours after online publication and is updated daily on week days.
Initial download of the metrics may take a while.