Fig. 1.
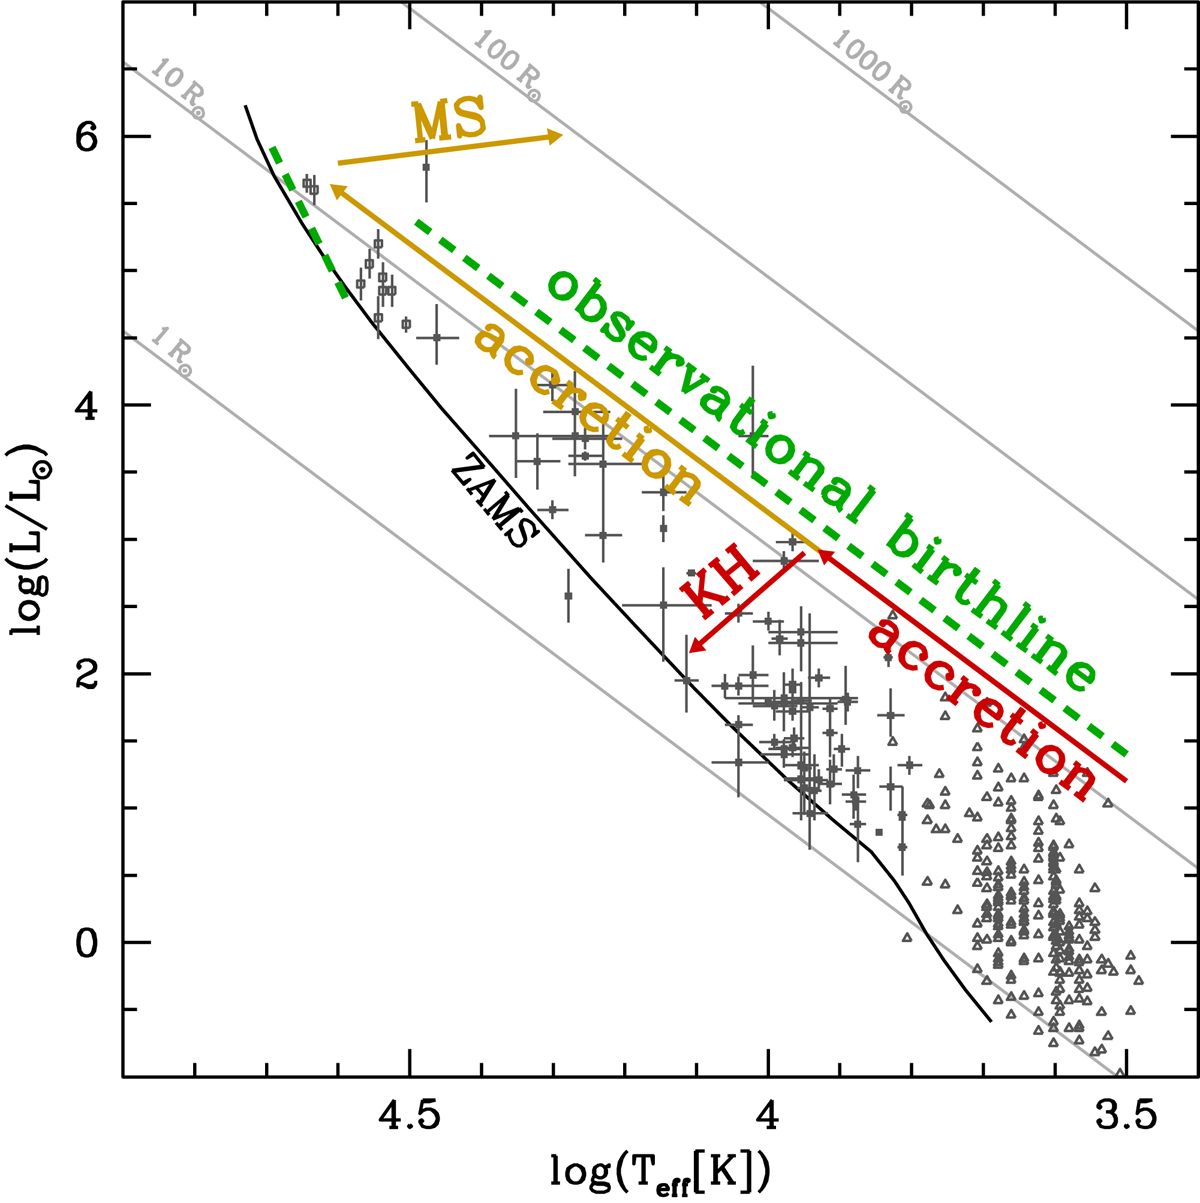
Schematic diagram of the birthline. The dots are observations of T Tauri stars (Cohen & Kuhi 1979, triangle), Herbig Ae/Be stars (Alecian et al. 2013, solid squares), and young O stars (Martins et al. 2012, open squares). Error bars are indicated when available. The black solid line is the ZAMS of Ekström et al. (2012), and the grey straight lines are iso-radius of indicated radii. The observational birthline (upper envelope of the observation) is illustrated in green. Red and orange arrows represent schematic tracks of intermediate-mass (red) and massive (orange) stars.
Current usage metrics show cumulative count of Article Views (full-text article views including HTML views, PDF and ePub downloads, according to the available data) and Abstracts Views on Vision4Press platform.
Data correspond to usage on the plateform after 2015. The current usage metrics is available 48-96 hours after online publication and is updated daily on week days.
Initial download of the metrics may take a while.