Fig. 1.
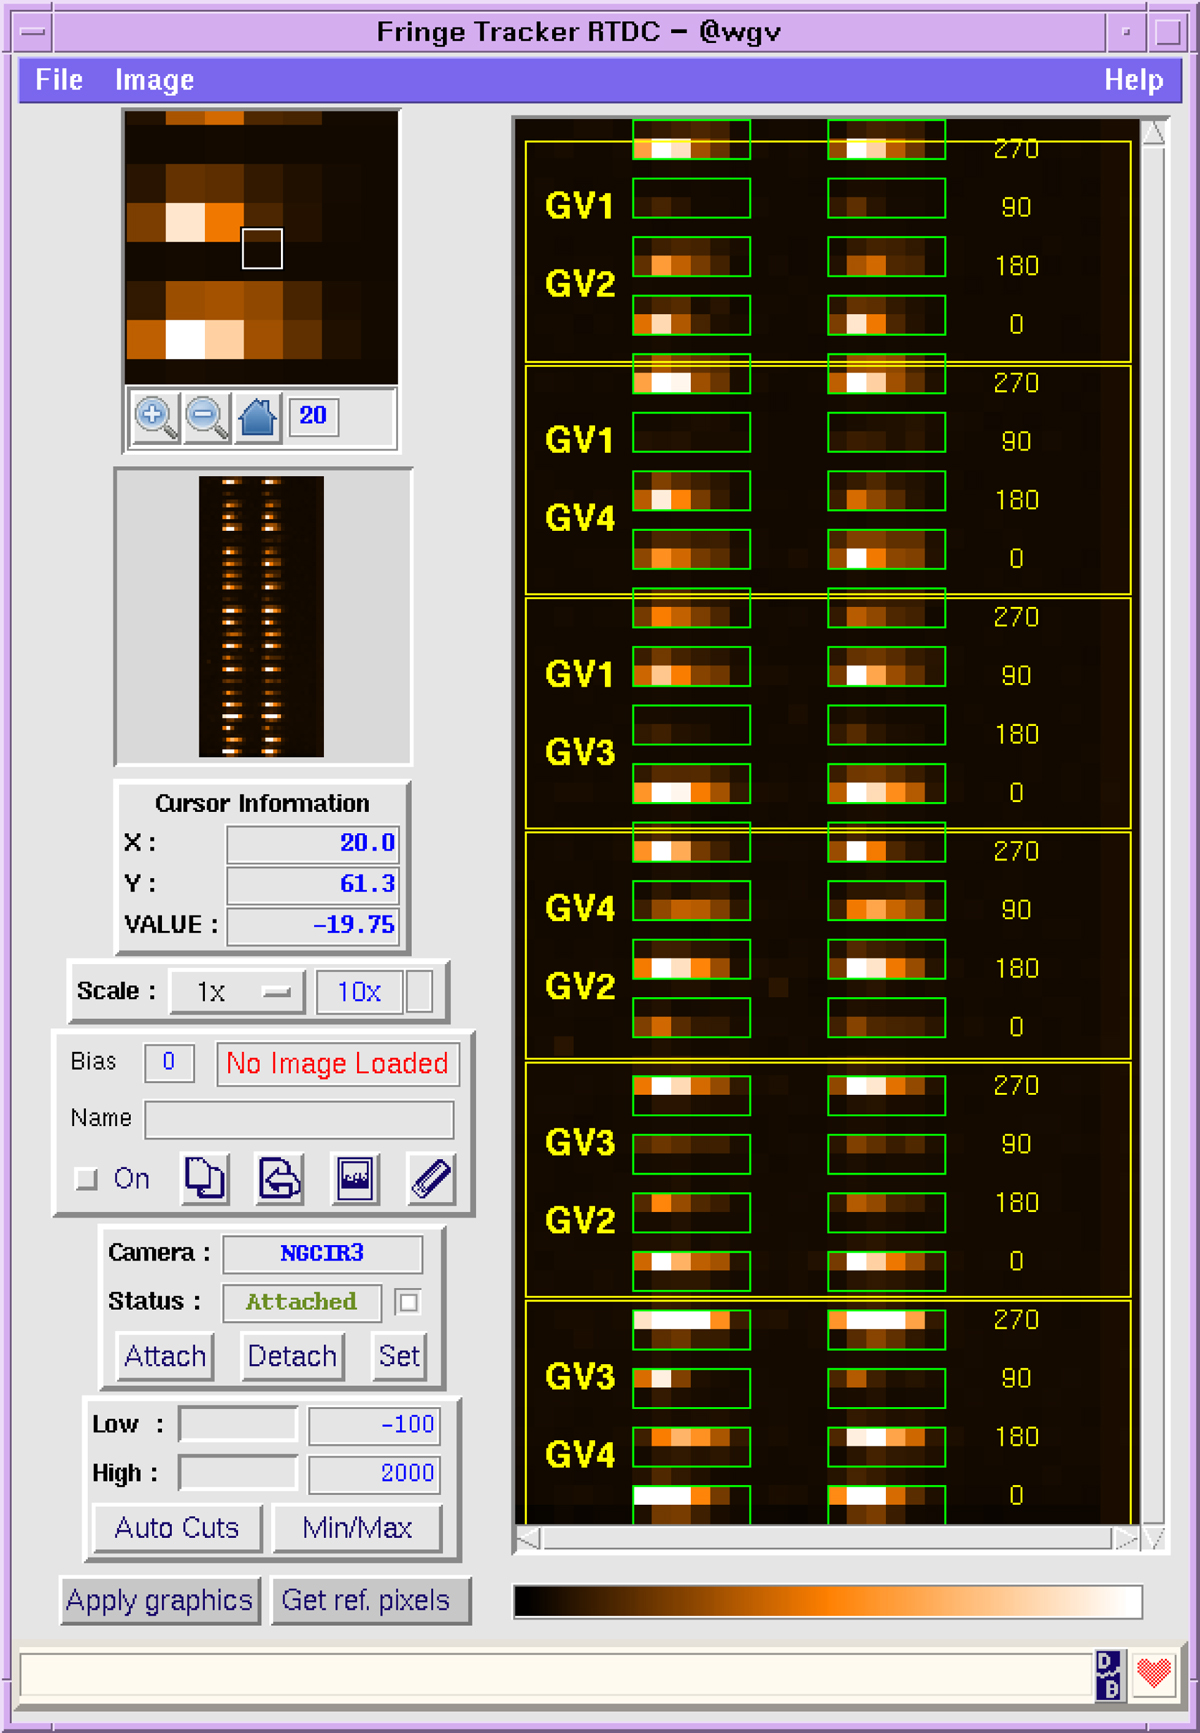
RTD of the SAPHIRA detector. The pixels in the green boxes are read by the fringe tracker and are used for tracking. They correspond to the six baselines, four ABCD outputs, two polarizations, and six wavelength channels. The names GV1 to GV4 correspond to the input beams. The values in yellow to the right correspond to the phase shift in degrees between the different ABCD outputs.
Current usage metrics show cumulative count of Article Views (full-text article views including HTML views, PDF and ePub downloads, according to the available data) and Abstracts Views on Vision4Press platform.
Data correspond to usage on the plateform after 2015. The current usage metrics is available 48-96 hours after online publication and is updated daily on week days.
Initial download of the metrics may take a while.