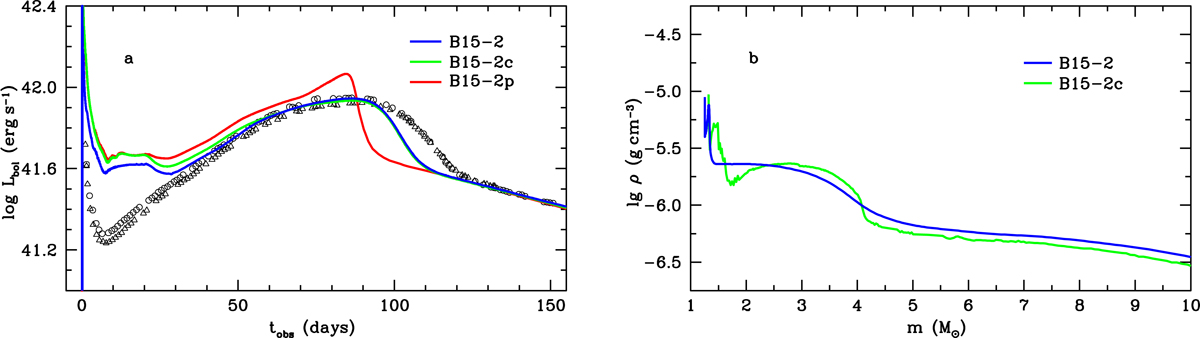
Fig. A.1.
Effect of 3D macroscopic mixing on the bolometric light curve (a) and the density profile as a function of interior mass at the mapping moment of t = 61 213 s (b). The reference model B15-2 (blue) is compared with model B15-2c (green), which is the 1D analog of model B15-2. Model B15-2c is based on the pre-SN model B15, is exploded by a piston, and its chemical composition is identical to that of the averaged 3D model B15-2. For a comparison, the red line shows the bolometric light curve of model B15-2p, which is based on the unmixed pre-SN model B15 and exploded by a piston. Open circles (Catchpole et al. 1987, 1988) and open triangles (Hamuy et al. 1988) are the bolometric data of SN 1987A.
Current usage metrics show cumulative count of Article Views (full-text article views including HTML views, PDF and ePub downloads, according to the available data) and Abstracts Views on Vision4Press platform.
Data correspond to usage on the plateform after 2015. The current usage metrics is available 48-96 hours after online publication and is updated daily on week days.
Initial download of the metrics may take a while.