Fig. 3.
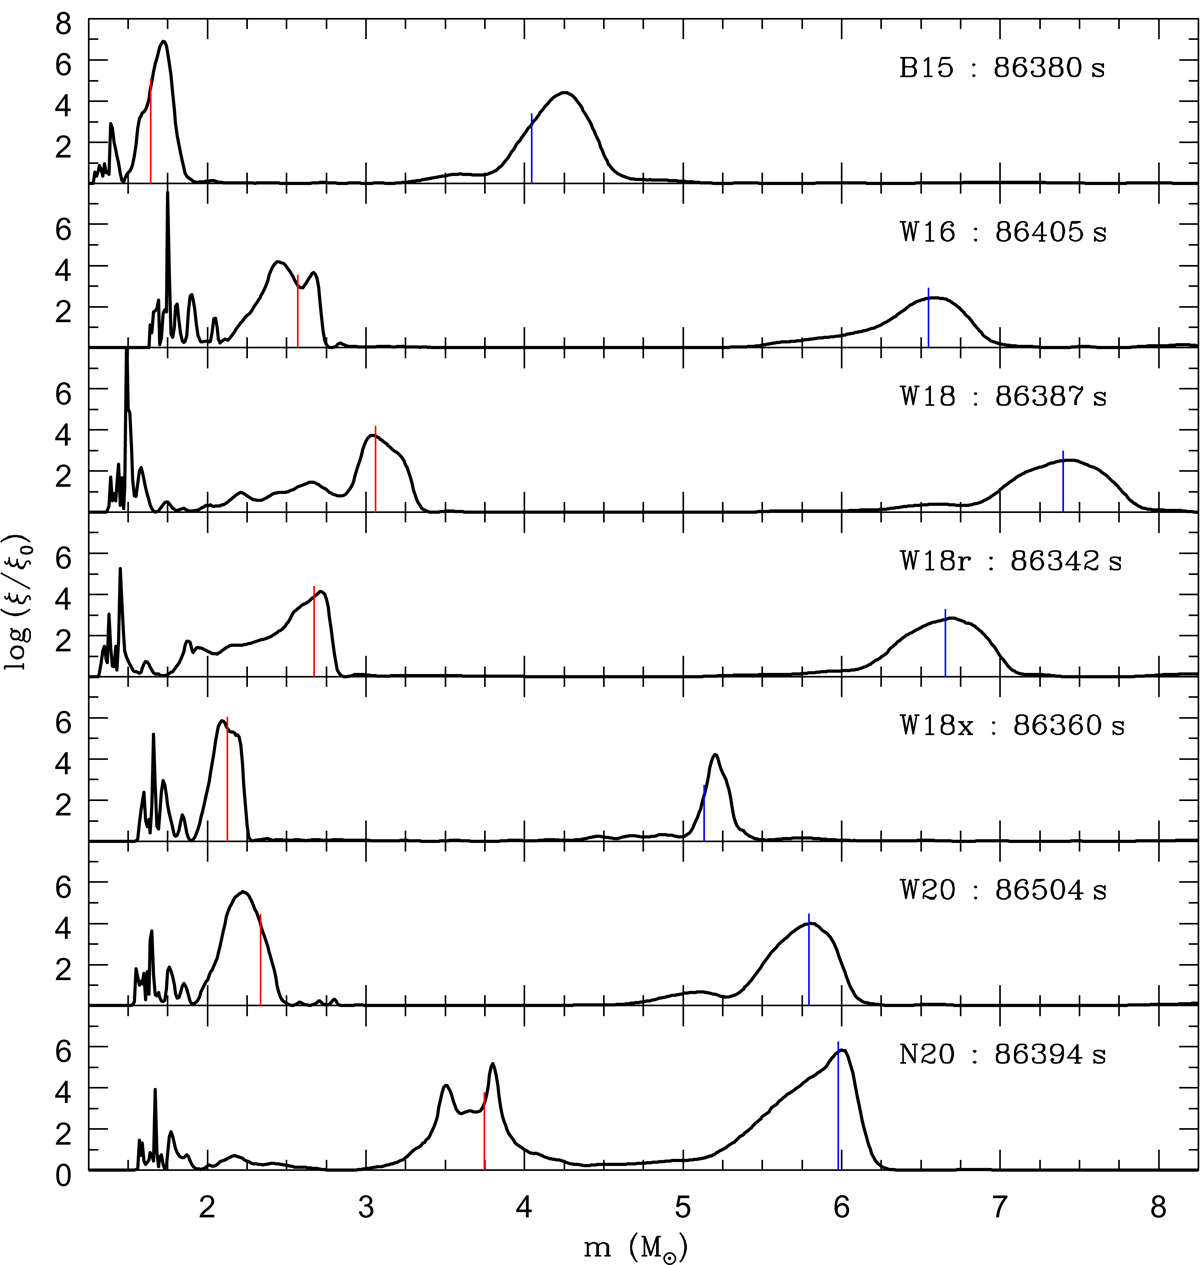
Time-integrated Rayleigh–Taylor growth factors vs. enclosed mass for the 1D hydrodynamic models B15, W16, W18, W18r, W18x, W20, and N20 at the given times. The vertical red and blue lines denote the mass coordinates of the (C+O)/He and He/H composition interfaces, respectively. These interfaces are Rayleigh–Taylor unstable after the passage of the SN shock.
Current usage metrics show cumulative count of Article Views (full-text article views including HTML views, PDF and ePub downloads, according to the available data) and Abstracts Views on Vision4Press platform.
Data correspond to usage on the plateform after 2015. The current usage metrics is available 48-96 hours after online publication and is updated daily on week days.
Initial download of the metrics may take a while.