Fig. 6.
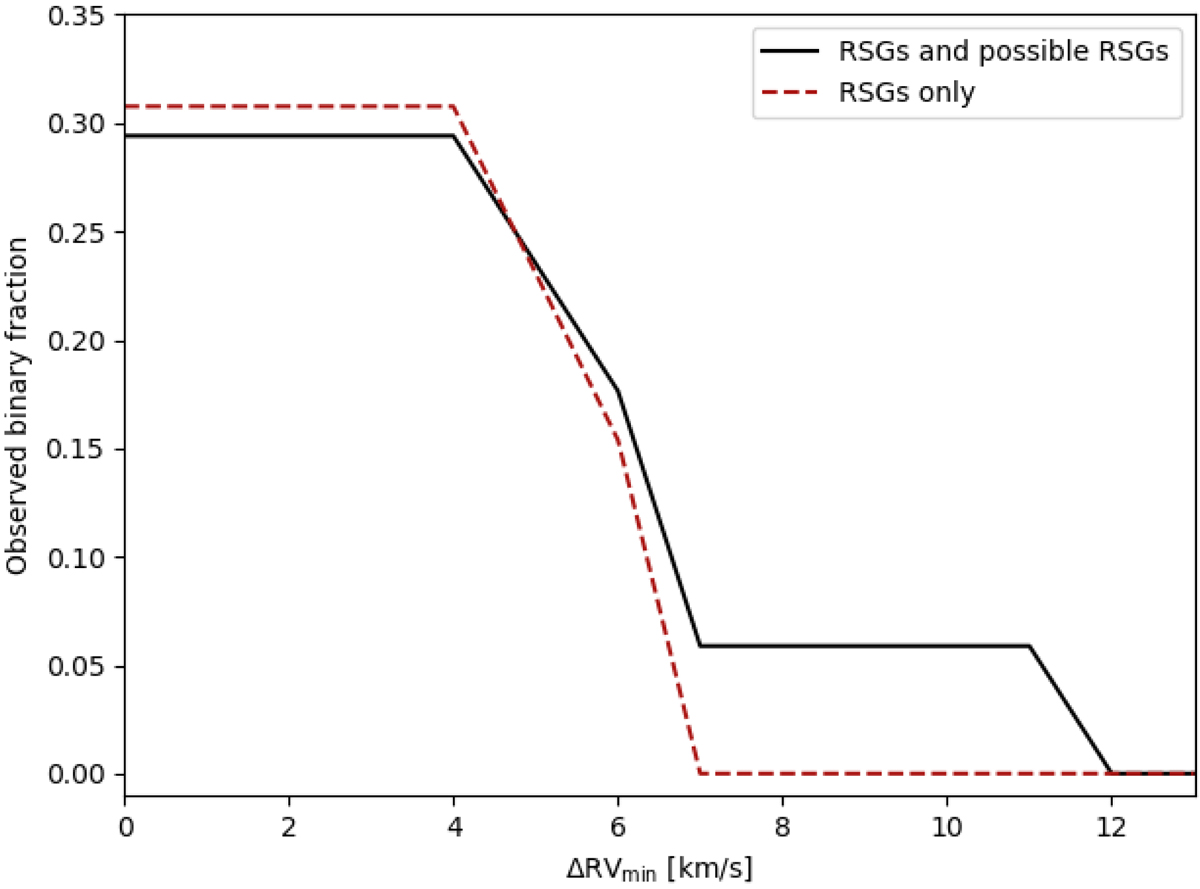
Fraction of systems that satisfy the 3σ variability criterion (Eq. (2)) as a function of the ΔRVmin variability criterion for the entire sample (black solid line) and for probable RSGs (red dashed line; as defined in B19). This figure highlights that the majority of the sample do not satisfy the 3σ variability criterion and that the maximum observed binary fraction is ∼0.30. Only one target in the sample (VFTS 744) displays significant variability above ΔRVmin = 7.0 km s−1.
Current usage metrics show cumulative count of Article Views (full-text article views including HTML views, PDF and ePub downloads, according to the available data) and Abstracts Views on Vision4Press platform.
Data correspond to usage on the plateform after 2015. The current usage metrics is available 48-96 hours after online publication and is updated daily on week days.
Initial download of the metrics may take a while.