Fig. 2.
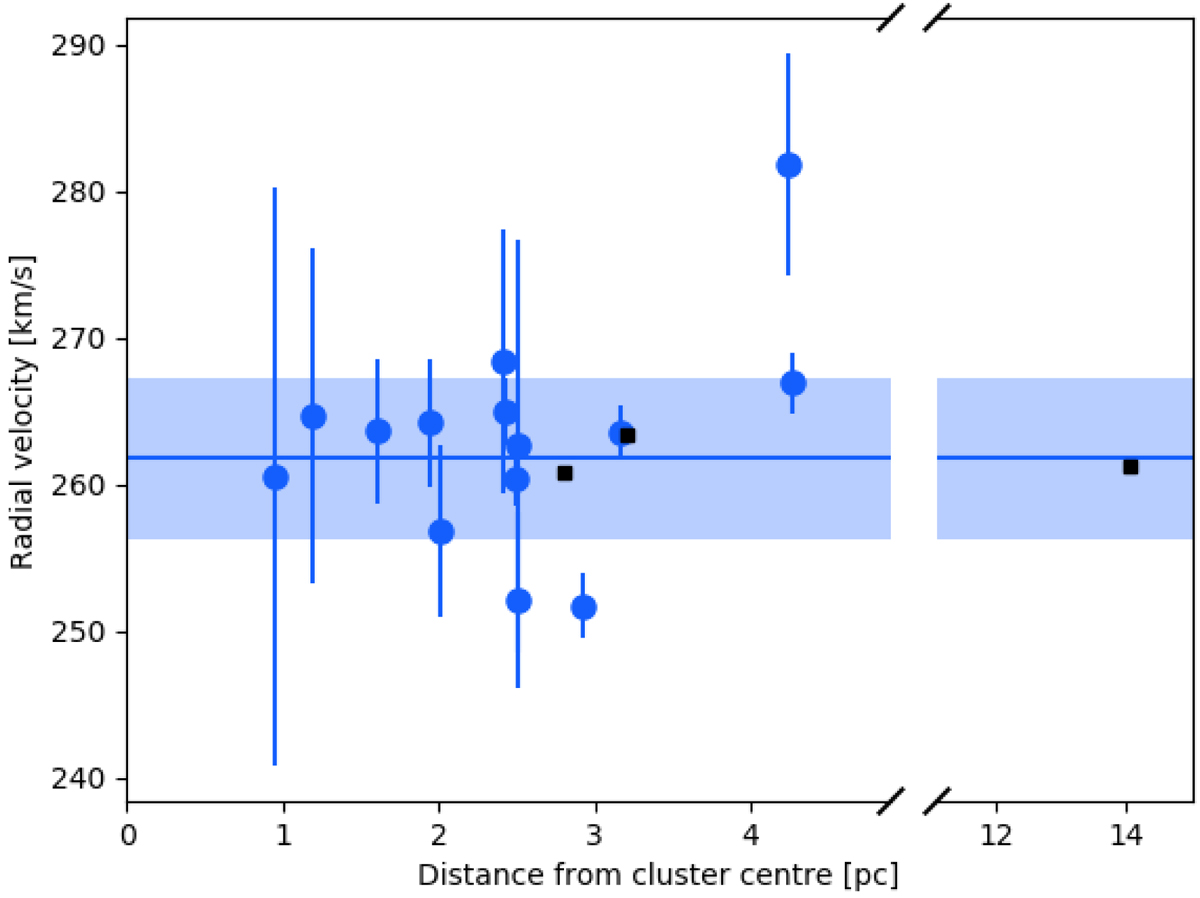
Radial velocity (RV) estimates for members of Hodge 301. Results for the B-type stars from Evans et al. (2015) are shown by the blue circles and estimates for the RSGs in this study are shown by the black squares (for which the uncertainties are not visible on this scale). The average and standard deviation of the B-type stars are indicated by the blue line and shaded region, respectively. The systemic velocity estimated from the RSGs is in excellent agreement with that from the hotter stars (see also Table 3).
Current usage metrics show cumulative count of Article Views (full-text article views including HTML views, PDF and ePub downloads, according to the available data) and Abstracts Views on Vision4Press platform.
Data correspond to usage on the plateform after 2015. The current usage metrics is available 48-96 hours after online publication and is updated daily on week days.
Initial download of the metrics may take a while.