Fig. A.1.
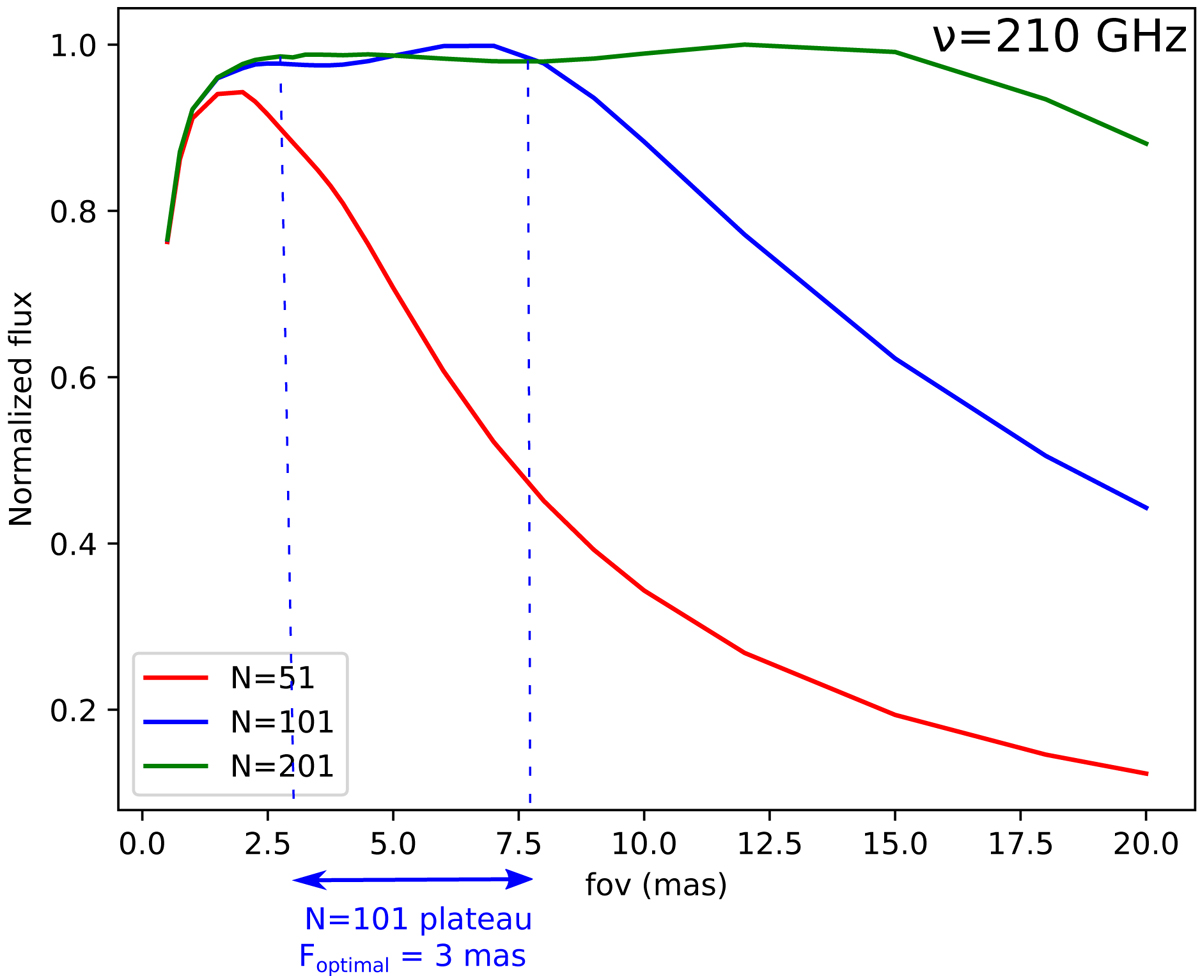
Evolution of the normalized ray-traced flux at ν = 210 GHz with increasing field of view for three values of screen resolution, N = 51 (red), N = 101 (blue), and N = 201 (green). The optimal value of field of view for a given resolution is the beginning of the plateau-phase of the curve (see text for details). The plateaus of the N = 101 and N = 201 curves are identical to within 0.1%, which shows that N = 101 is the smallest resolution that ensures accurate flux values, associated to F = 3 mas.
Current usage metrics show cumulative count of Article Views (full-text article views including HTML views, PDF and ePub downloads, according to the available data) and Abstracts Views on Vision4Press platform.
Data correspond to usage on the plateform after 2015. The current usage metrics is available 48-96 hours after online publication and is updated daily on week days.
Initial download of the metrics may take a while.