Fig. 7.
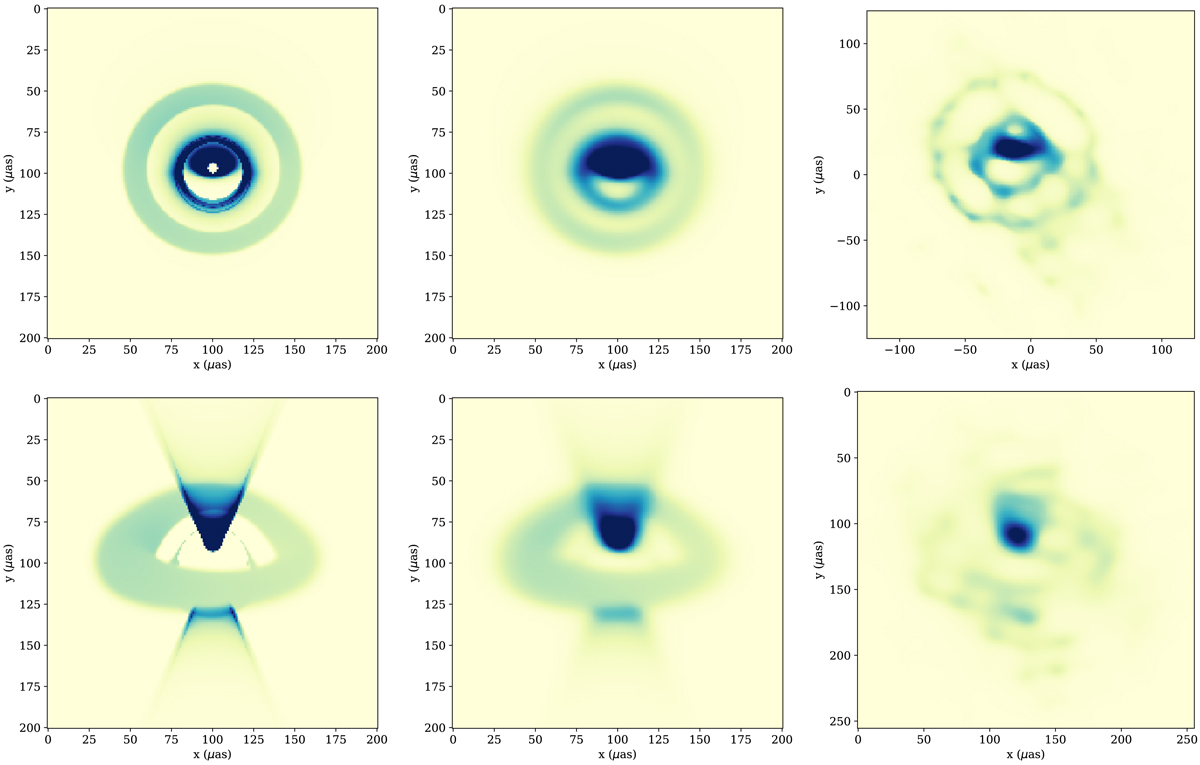
Example of model images reconstruction with the synthetic EHT array. For display purposes color maps saturate at 0.001 Jy px−1. Left column: original synthetic images generated with our model (same as Fig. 4). Middle column: model images as processed by the interstellar scattering screen (Johnson et al. 2018). Right column: MEM reconstruction of images, observed by a synthetic EHT 2017 array (Chael et al. 2016). Fitting an elliptical Gaussian component to images we find a characteristic size [major axis, minor axis] of [97,72] μas for the top row image and [100,89] μas for the bottom row image.
Current usage metrics show cumulative count of Article Views (full-text article views including HTML views, PDF and ePub downloads, according to the available data) and Abstracts Views on Vision4Press platform.
Data correspond to usage on the plateform after 2015. The current usage metrics is available 48-96 hours after online publication and is updated daily on week days.
Initial download of the metrics may take a while.