Fig. 6.
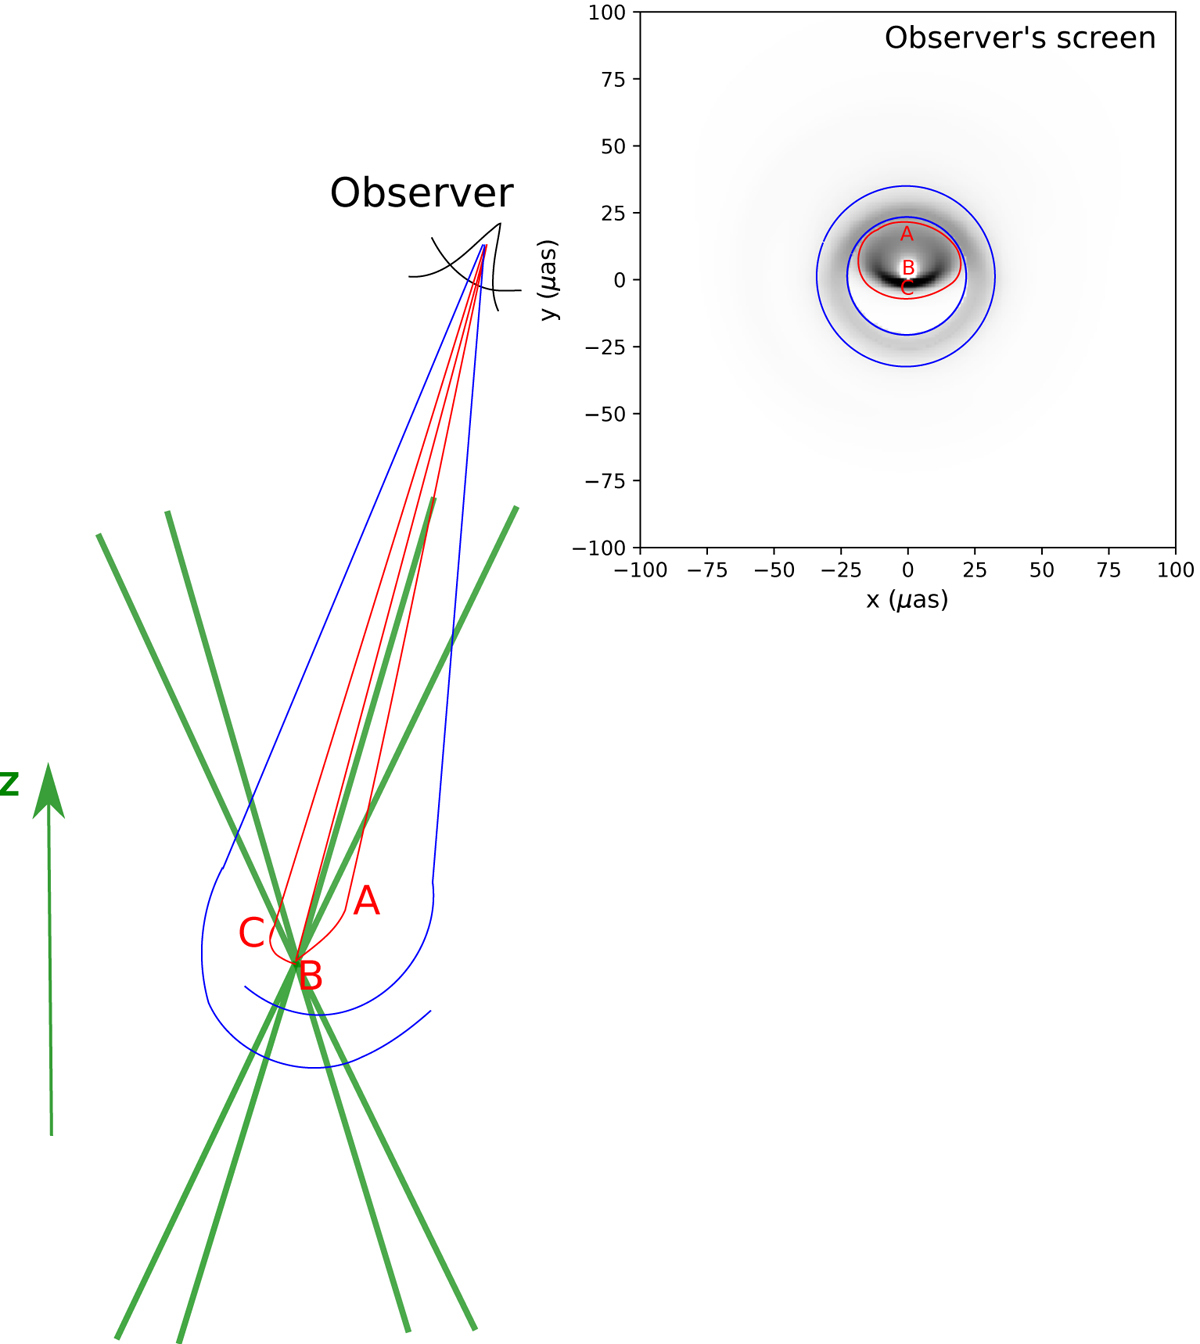
Green contours: scheme of the jet sheath on both parts (z > 0 and z < 0) of the black hole. The observer is at i = 20° at the top of the figure, with the observation screen represented at the top right. It is identical to the left panel of Fig. 5. Two regions are highlighted in red and blue. The red part is the primary image of the regions close to the z > 0 base of the jet. Three examples of geodesics, ray-traced backwards in time from the screen of the observer, A, B, and C, are represented on the scheme, all of them ending their trajectory inside the black hole. Their end points on the screen of the observer are labeled. Geodesic C carries more flux, because it has visited regions very close to the base of the jet. While geodesic B, falling (backwards) straight into the black hole, carries no flux. The toroidal blue region on the screen of the observer is the secondary image of the jet, due to photons that are strongly bent in the regions close to the z < 0 base of the jet, before reaching the far-away observer. Two such strongly bent geodesics are depicted in blue on the scheme. This structure can therefore be seen as the Einstein ring of the z < 0 base of the jet.
Current usage metrics show cumulative count of Article Views (full-text article views including HTML views, PDF and ePub downloads, according to the available data) and Abstracts Views on Vision4Press platform.
Data correspond to usage on the plateform after 2015. The current usage metrics is available 48-96 hours after online publication and is updated daily on week days.
Initial download of the metrics may take a while.