Open Access
Fig. 5.
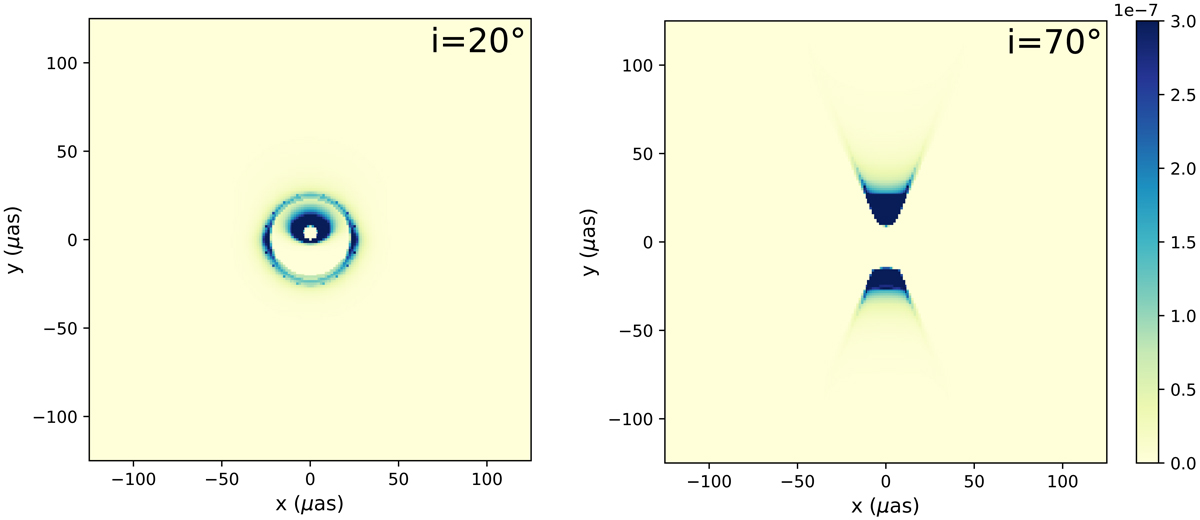
Best-fit torus+jet image at 2.2 μm, as seen at inclination i = 20° (left panel) and i = 70° (right panel). The color bar is common to both panels and gives the values of specific intensity in cgs units. As in Fig. 4, the color hue is somewhat saturated for better visualization.
Current usage metrics show cumulative count of Article Views (full-text article views including HTML views, PDF and ePub downloads, according to the available data) and Abstracts Views on Vision4Press platform.
Data correspond to usage on the plateform after 2015. The current usage metrics is available 48-96 hours after online publication and is updated daily on week days.
Initial download of the metrics may take a while.