Fig. 4.
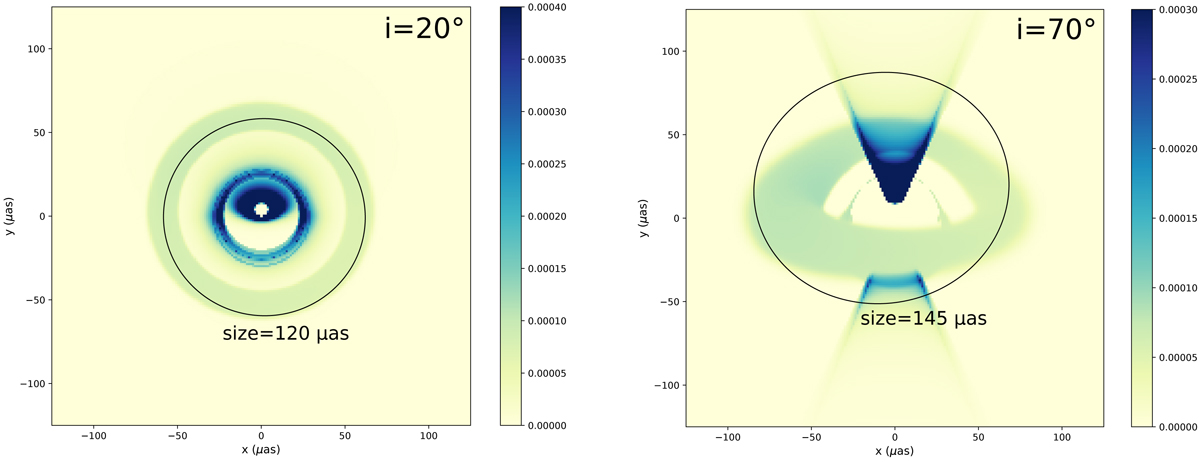
Best-fit torus+jet image at 1.3 mm, as seen at inclination i = 20° (left panel) and i = 70° (right panel). The color bar is different for the two images to optimize the readability of each panel. It gives the value of the specific intensity in cgs units. The color hue is somewhat saturated to make it easier to see the fainter torus. As a consequence, the maximum value of the specific intensity is somewhat higher than the highest number of the color bars: 0.0015 for the left panel, and 0.001 for the right panel, in cgs units. The black ellipses are obtained by deriving the central moments of the images (see text for details) and give an estimate of the size of the emitting region, which is written explicitly in each panel.
Current usage metrics show cumulative count of Article Views (full-text article views including HTML views, PDF and ePub downloads, according to the available data) and Abstracts Views on Vision4Press platform.
Data correspond to usage on the plateform after 2015. The current usage metrics is available 48-96 hours after online publication and is updated daily on week days.
Initial download of the metrics may take a while.