Fig. 3.
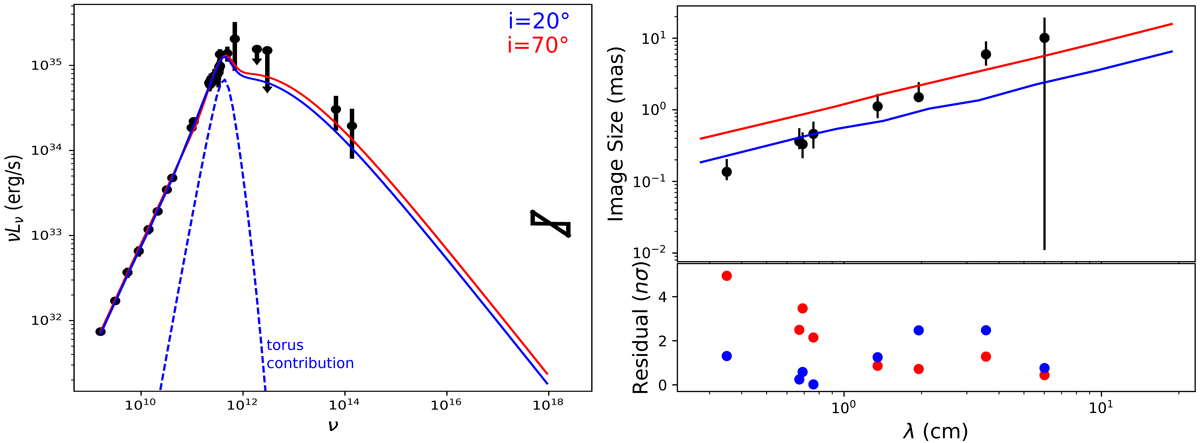
Left panel: best-fit torus+jet quiescent spectrum at i = 20° (blue, ![]() , with the torus-only contribution dashed; it is very similar for both inclinations and therefore we represent only the i = 20° case) and i = 70° (red,
, with the torus-only contribution dashed; it is very similar for both inclinations and therefore we represent only the i = 20° case) and i = 70° (red, ![]() ). The data are taken from Bower et al. (2015, all radio data except the four following points), Brinkerink et al. (2015, for the 2 points around 100 GHz), Liu et al. (2016, for the 492 GHz point), Marrone et al. (2006, for the 690 GHz point), von Fellenberg et al. (2018, for the far infrared upper limits), Witzel et al. (2018, or the mid infrared data), and Baganoff et al. (2001, for the X-ray bow-tie). We note that the X-ray data are not fitted as we do not take into account bremsstrahlung nor Comptonized emission. Right panel: corresponding image major axis at radio wavelengths (upper panel), with data from Bower et al. (2006). Lower panel: residual in units of σ.
). The data are taken from Bower et al. (2015, all radio data except the four following points), Brinkerink et al. (2015, for the 2 points around 100 GHz), Liu et al. (2016, for the 492 GHz point), Marrone et al. (2006, for the 690 GHz point), von Fellenberg et al. (2018, for the far infrared upper limits), Witzel et al. (2018, or the mid infrared data), and Baganoff et al. (2001, for the X-ray bow-tie). We note that the X-ray data are not fitted as we do not take into account bremsstrahlung nor Comptonized emission. Right panel: corresponding image major axis at radio wavelengths (upper panel), with data from Bower et al. (2006). Lower panel: residual in units of σ.
Current usage metrics show cumulative count of Article Views (full-text article views including HTML views, PDF and ePub downloads, according to the available data) and Abstracts Views on Vision4Press platform.
Data correspond to usage on the plateform after 2015. The current usage metrics is available 48-96 hours after online publication and is updated daily on week days.
Initial download of the metrics may take a while.