Open Access
Fig. 2.
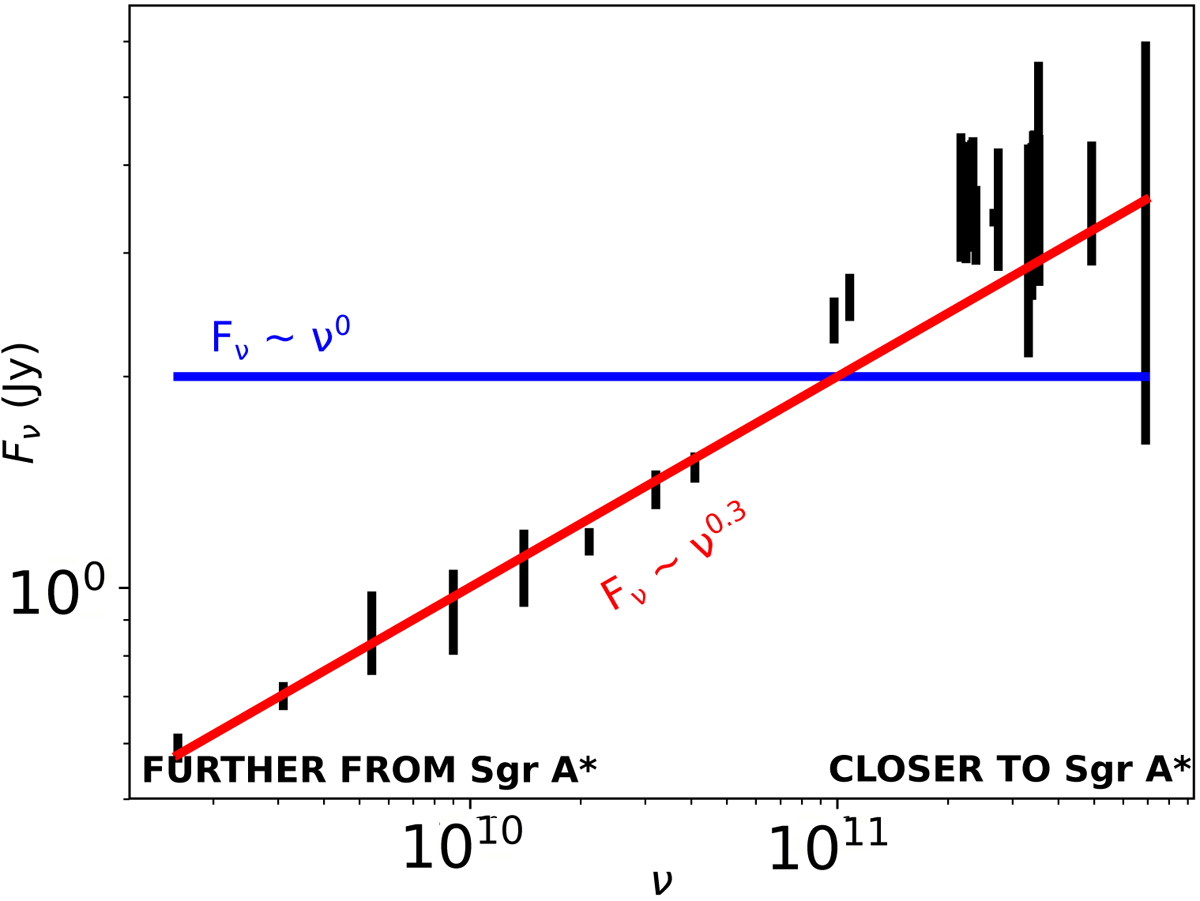
The radio to millimeter spectrum of Sgr A* (black error bars are as in Fig. 3). The blue horizontal line shows the spectrum produced by an isothermal jet. The red line shows what is needed by the data.
Current usage metrics show cumulative count of Article Views (full-text article views including HTML views, PDF and ePub downloads, according to the available data) and Abstracts Views on Vision4Press platform.
Data correspond to usage on the plateform after 2015. The current usage metrics is available 48-96 hours after online publication and is updated daily on week days.
Initial download of the metrics may take a while.