Fig. 3.
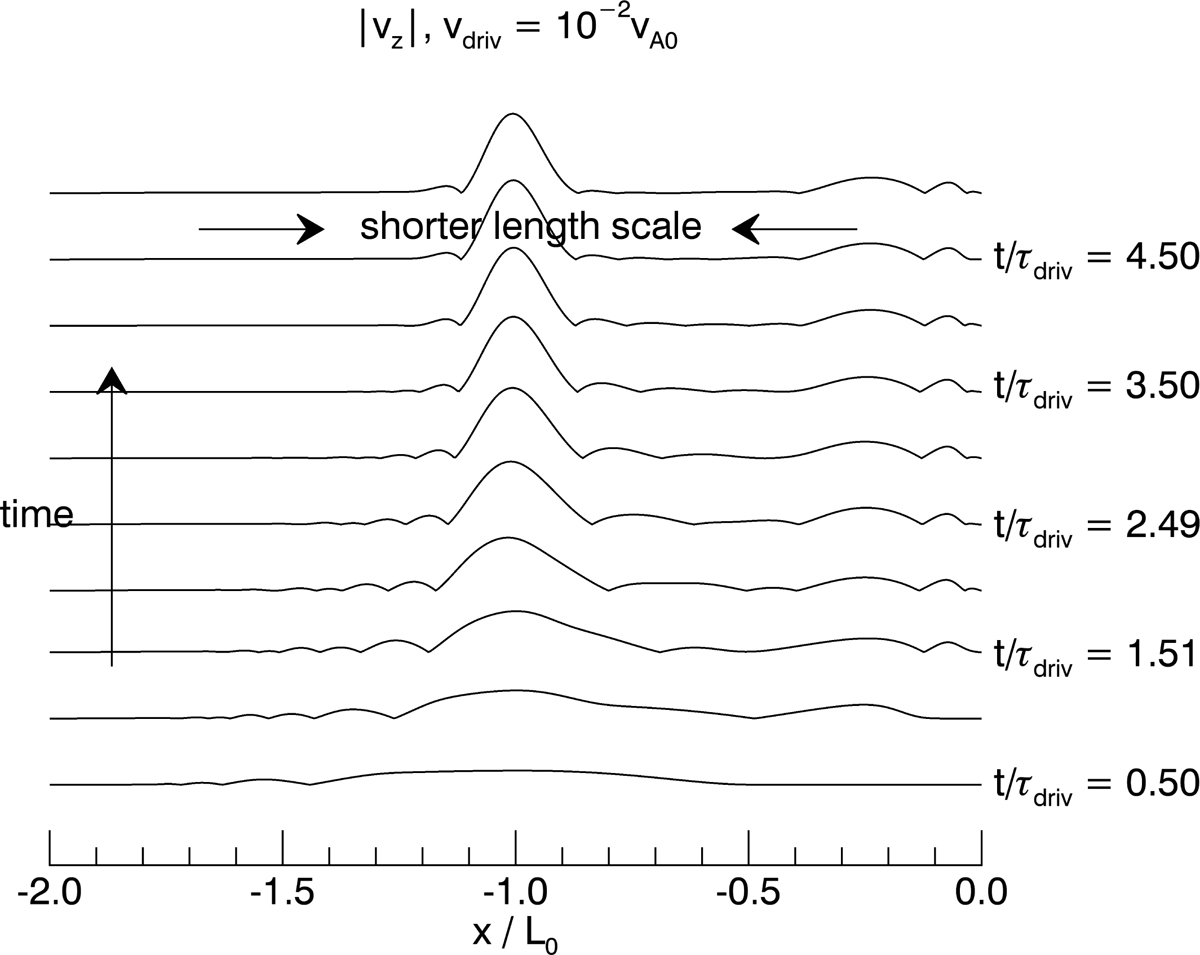
Absolute value of the velocity, |υz|, associated with the Alfvén waves along the line y = x at different times. The line y = x is perpendicular to the field lines and this shows the variation in υz across the field lines. The figure shows that the length scale across the field lines is shortened as time progresses and so phase mixing is occurring.
Current usage metrics show cumulative count of Article Views (full-text article views including HTML views, PDF and ePub downloads, according to the available data) and Abstracts Views on Vision4Press platform.
Data correspond to usage on the plateform after 2015. The current usage metrics is available 48-96 hours after online publication and is updated daily on week days.
Initial download of the metrics may take a while.