Fig. 10.
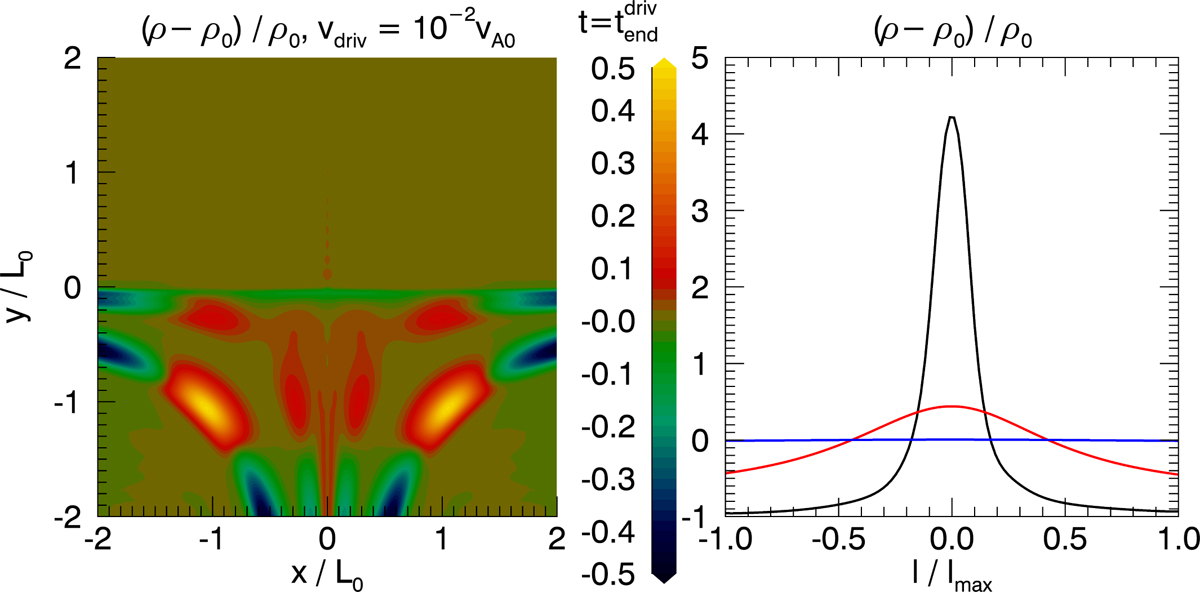
Left panel: contour of the density after the driving has finished for the experiment where a driver amplitude of υdriv = 10−2υA0 is used. Right panel: density along one of the outer most resonant field lines for all three experiments, where the same colour scheme is used as in previous plots. The value lmax is equal to twice the length of the field line and l is a variable giving the distance from the centre of the field line.
Current usage metrics show cumulative count of Article Views (full-text article views including HTML views, PDF and ePub downloads, according to the available data) and Abstracts Views on Vision4Press platform.
Data correspond to usage on the plateform after 2015. The current usage metrics is available 48-96 hours after online publication and is updated daily on week days.
Initial download of the metrics may take a while.