Fig. 1.
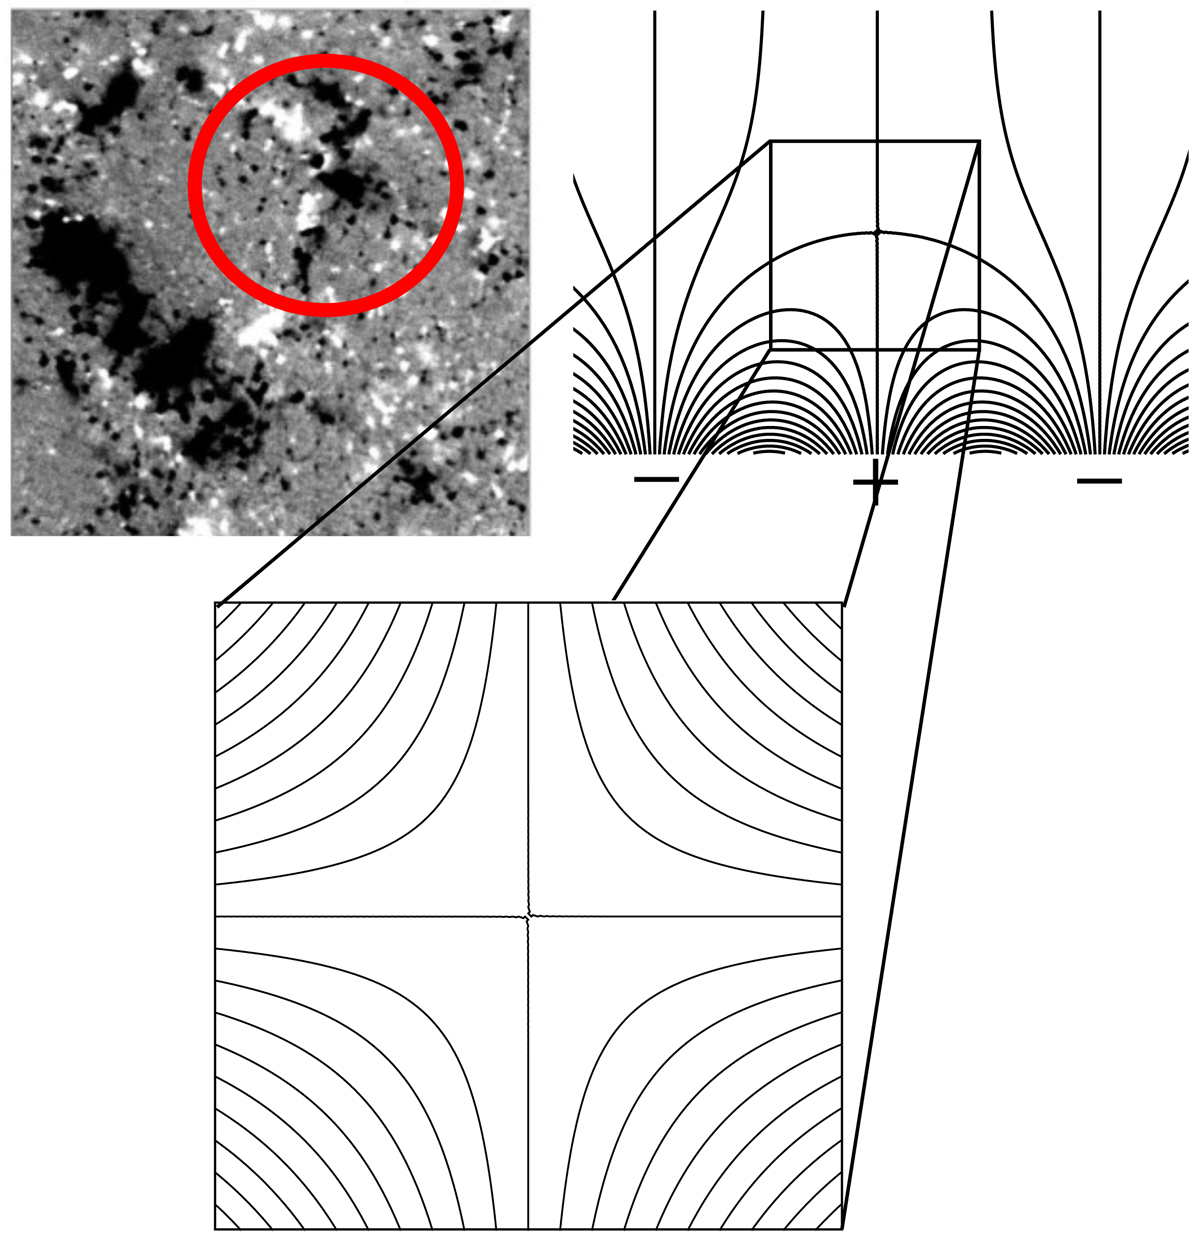
Top left panel: magnetogram taken from the Hinode spacecraft of a mixed-polarity region. Top right panel: a simplified diagram of the magnetic field configuration in a mixed polarity region when viewed edge on (for example when viewed on the solar limb). Bottom panel: isolates the centre of the top right panel and is the profile of the magnetic field used in the numerical experiments of this paper.
Current usage metrics show cumulative count of Article Views (full-text article views including HTML views, PDF and ePub downloads, according to the available data) and Abstracts Views on Vision4Press platform.
Data correspond to usage on the plateform after 2015. The current usage metrics is available 48-96 hours after online publication and is updated daily on week days.
Initial download of the metrics may take a while.