Free Access
Fig. 9.
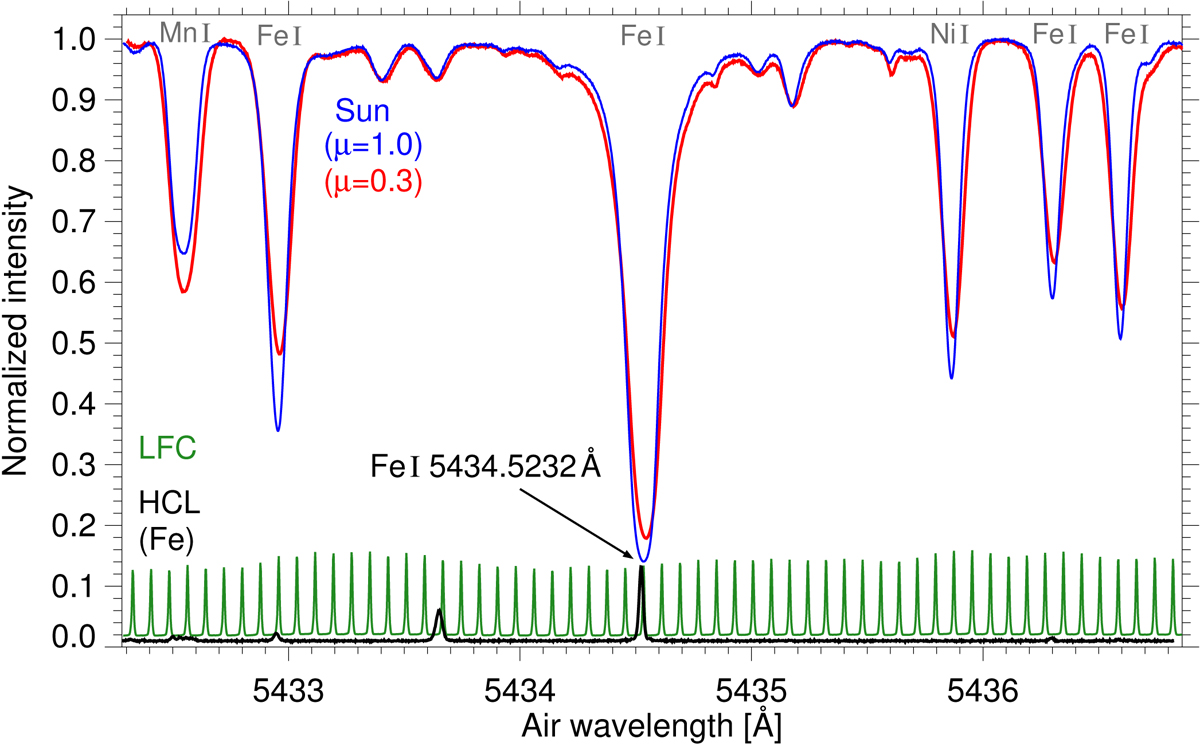
Center-to-limb variation of the C I 5380.3 Å line. Panel a: displays the average line bisectors from the disk center (μ = 1.0) toward the solar limb (μ = 0.3). Panel b: average convective spectra of the laser frequency comb (LFC, green curve) and the iron hollow cathode lamp (HCL, black curve) are displayed.
Current usage metrics show cumulative count of Article Views (full-text article views including HTML views, PDF and ePub downloads, according to the available data) and Abstracts Views on Vision4Press platform.
Data correspond to usage on the plateform after 2015. The current usage metrics is available 48-96 hours after online publication and is updated daily on week days.
Initial download of the metrics may take a while.