Free Access
Fig. 7.
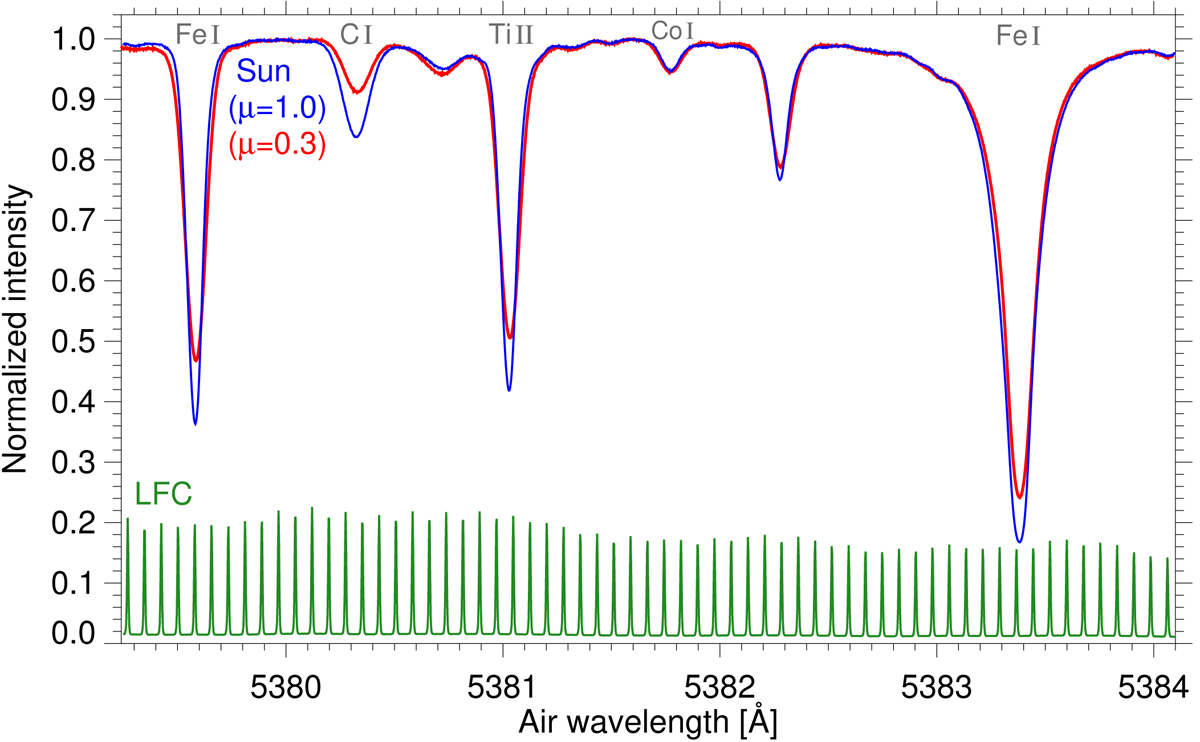
Spectral region around 5381 Å, with the quiet Sun absorption spectra at the disk center (μ = 1.0, blue curve) and close to the solar limb (μ = 0.3, red curve). The atomic species are stated in gray. The spectrum of the laser frequency comb (LFC) is displayed as green curve.
Current usage metrics show cumulative count of Article Views (full-text article views including HTML views, PDF and ePub downloads, according to the available data) and Abstracts Views on Vision4Press platform.
Data correspond to usage on the plateform after 2015. The current usage metrics is available 48-96 hours after online publication and is updated daily on week days.
Initial download of the metrics may take a while.