Fig. 5.
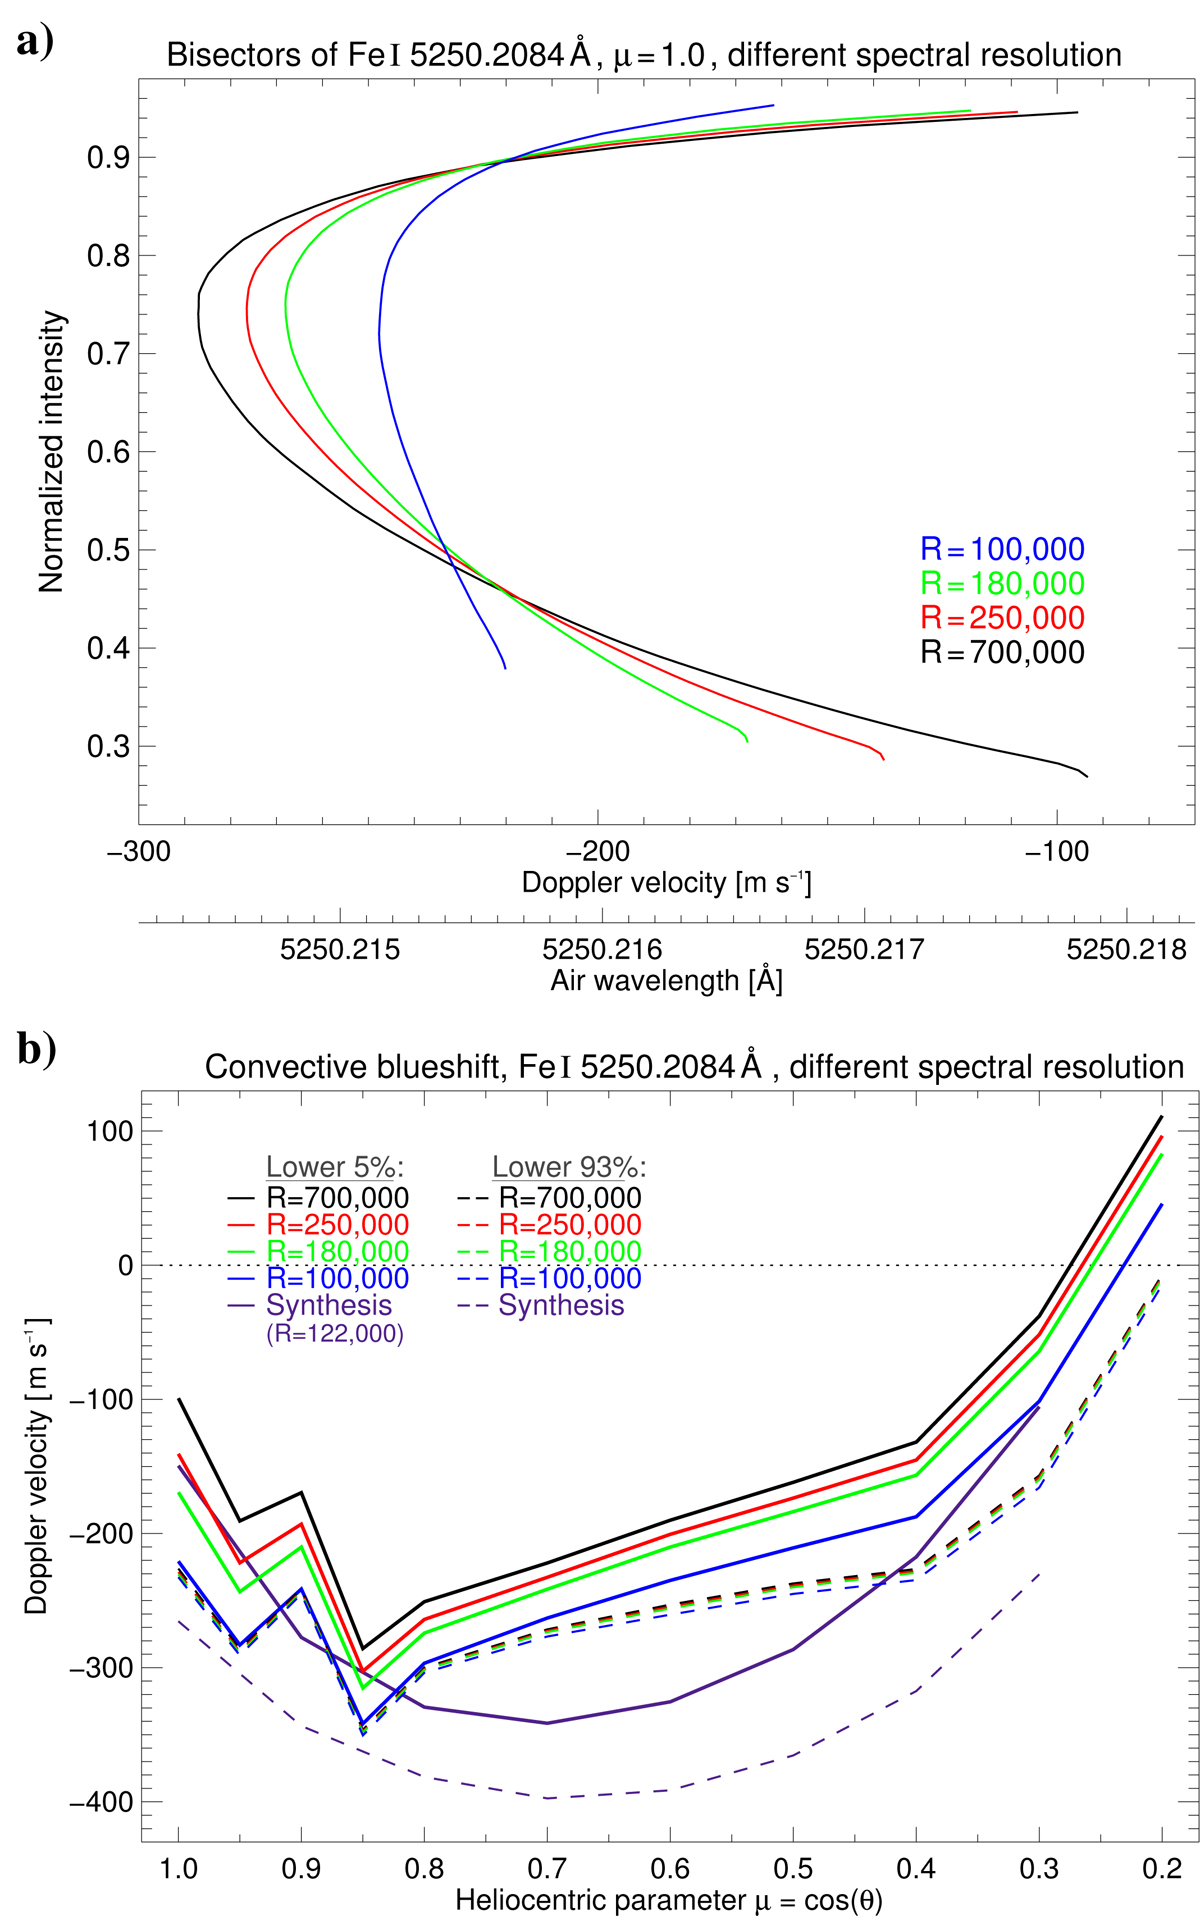
Analysis of the convective blueshift of Fe I 5250.2 Å for different spectral resolutions R, from 700 000 (black) to 100 000 (blue). Panel a: highlights the impact of the resolution on the line bisector (at μ = 1.0). Panel b: center-to-limb variation of the convective blueshift, obtained for the line core (lower 5% of the bisector; solid lines) or the entire profile (lower 93%; dashed lines). The syntheses of de la Cruz Rodríguez et al. (2011) are compared as purple lines.
Current usage metrics show cumulative count of Article Views (full-text article views including HTML views, PDF and ePub downloads, according to the available data) and Abstracts Views on Vision4Press platform.
Data correspond to usage on the plateform after 2015. The current usage metrics is available 48-96 hours after online publication and is updated daily on week days.
Initial download of the metrics may take a while.