Fig. A.5.
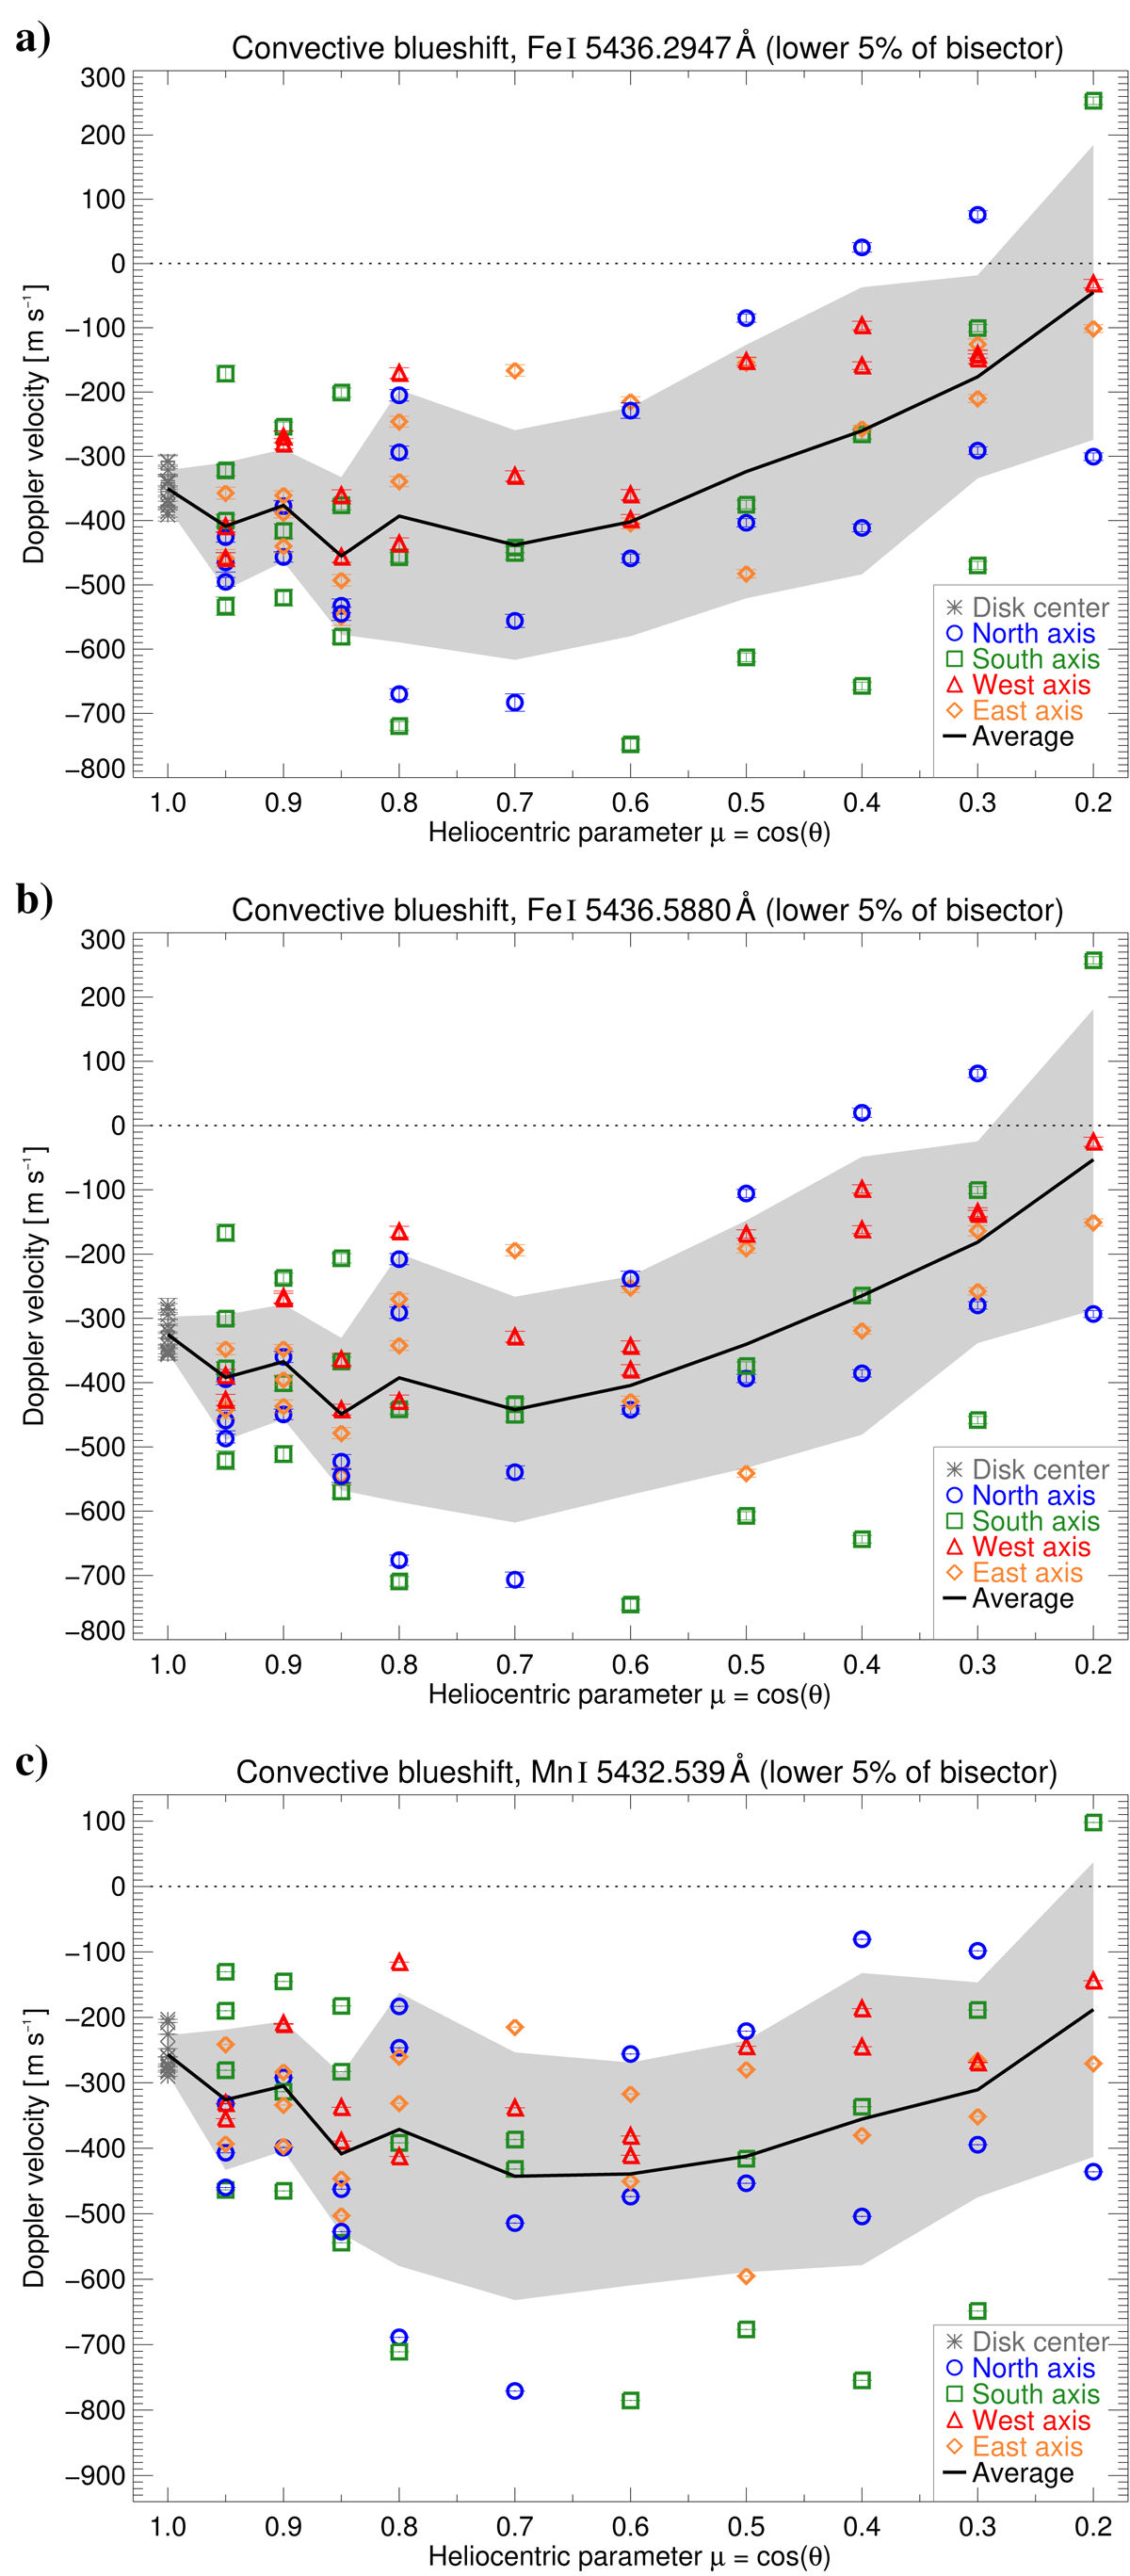
Center-to-limb variation of the convective blueshift of the Fe I 5436.3 Å (panel a), Fe I 5436.6 Å (panel b), and Mn I 5432.6 Å (panel c) line. Each data point represents the mean Doppler velocity of the lower 5% of the bisector of the temporally averaged observation sequence. Error bars indicate the mean error. Radial axes are indicated by colors and symbols. The black solid line and gray shaded area display the average center-to-limb variation and its standard deviation.
Current usage metrics show cumulative count of Article Views (full-text article views including HTML views, PDF and ePub downloads, according to the available data) and Abstracts Views on Vision4Press platform.
Data correspond to usage on the plateform after 2015. The current usage metrics is available 48-96 hours after online publication and is updated daily on week days.
Initial download of the metrics may take a while.