Fig. 21.
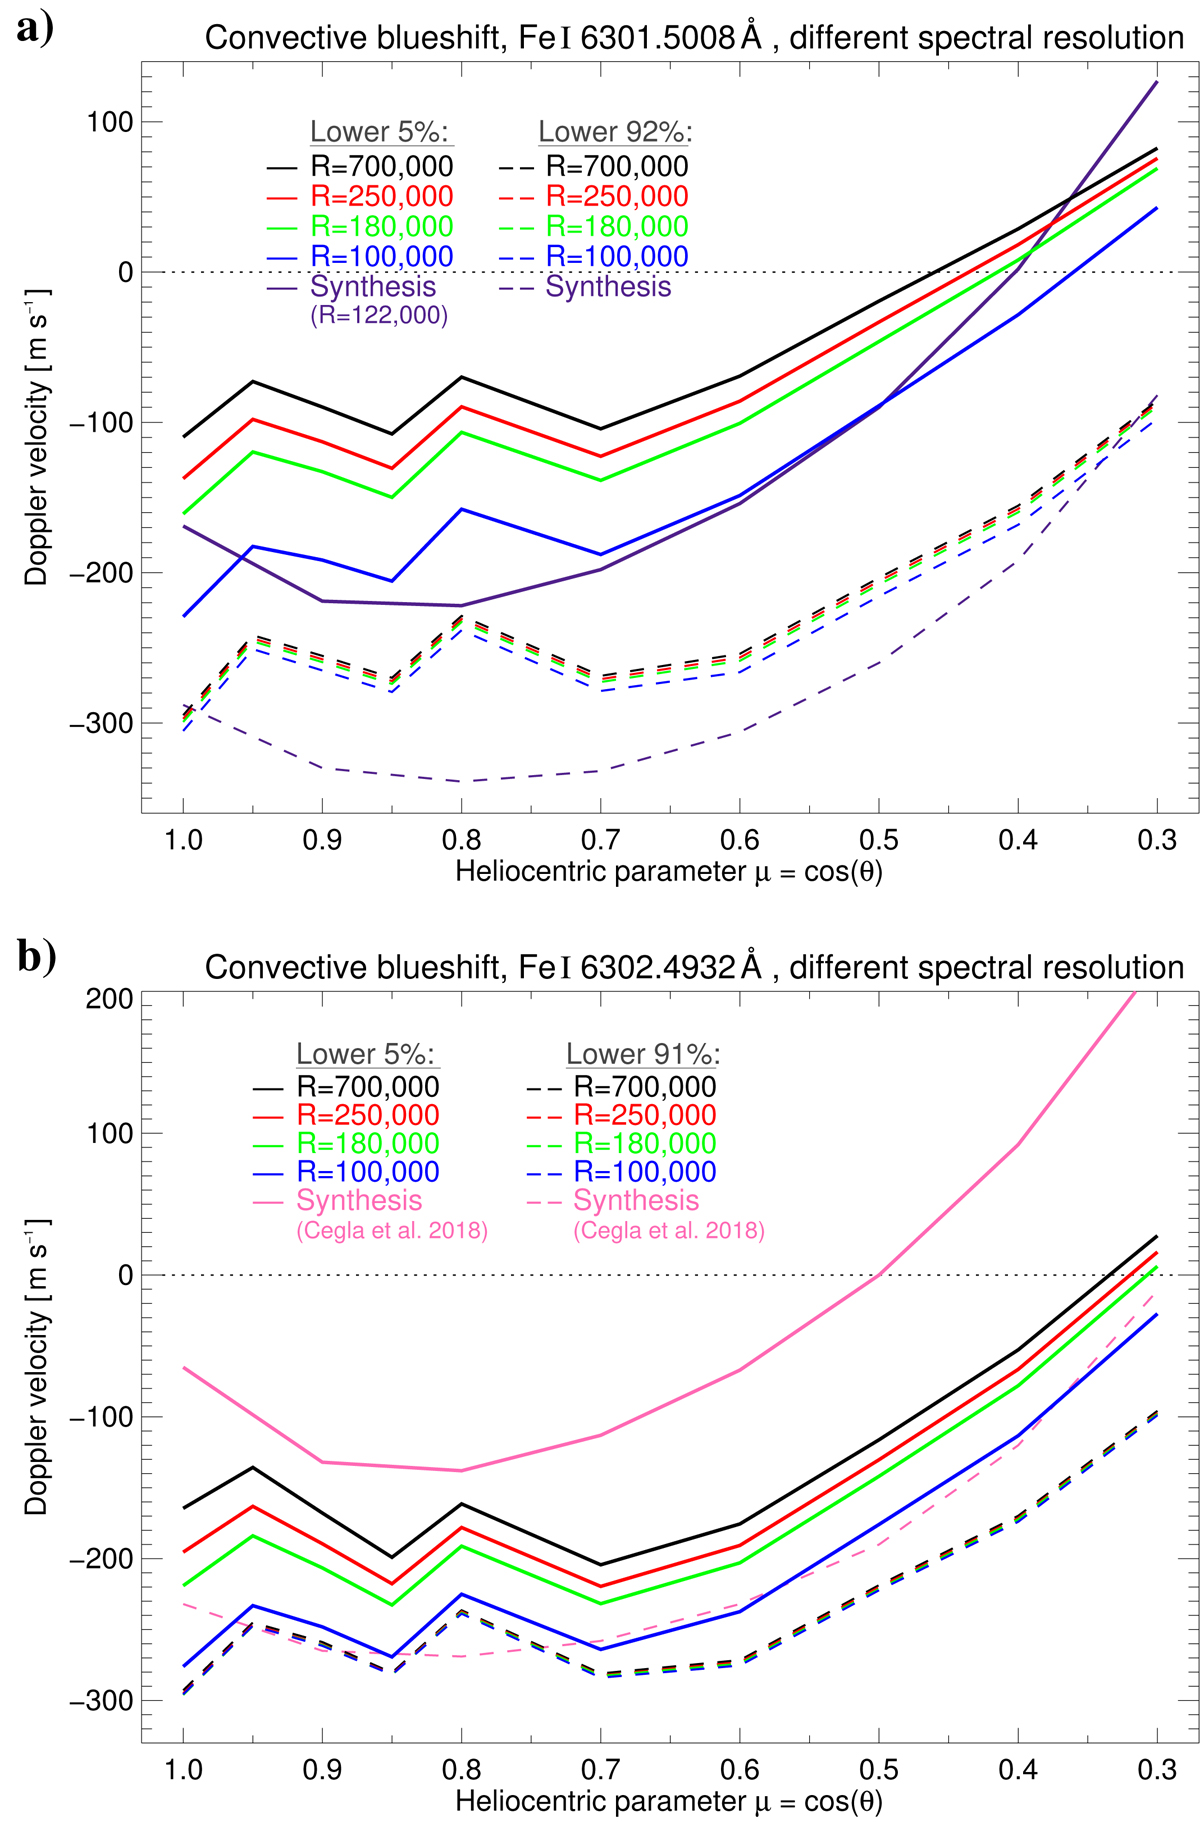
Center-to-limb variation of the convective blueshift of Fe I 6301.5 Å (panel a) and Fe I 6302.5 Å (panel b) for different spectral resolutions and line sections. Dashed lines are close to each other or even overlay. The observations are compared with the synthesis for Fe I 6301.5 Å (de la Cruz Rodríguez et al. 2011) and Fe I 6302.5 Å (Cegla et al. 2018).
Current usage metrics show cumulative count of Article Views (full-text article views including HTML views, PDF and ePub downloads, according to the available data) and Abstracts Views on Vision4Press platform.
Data correspond to usage on the plateform after 2015. The current usage metrics is available 48-96 hours after online publication and is updated daily on week days.
Initial download of the metrics may take a while.