Fig. 19.
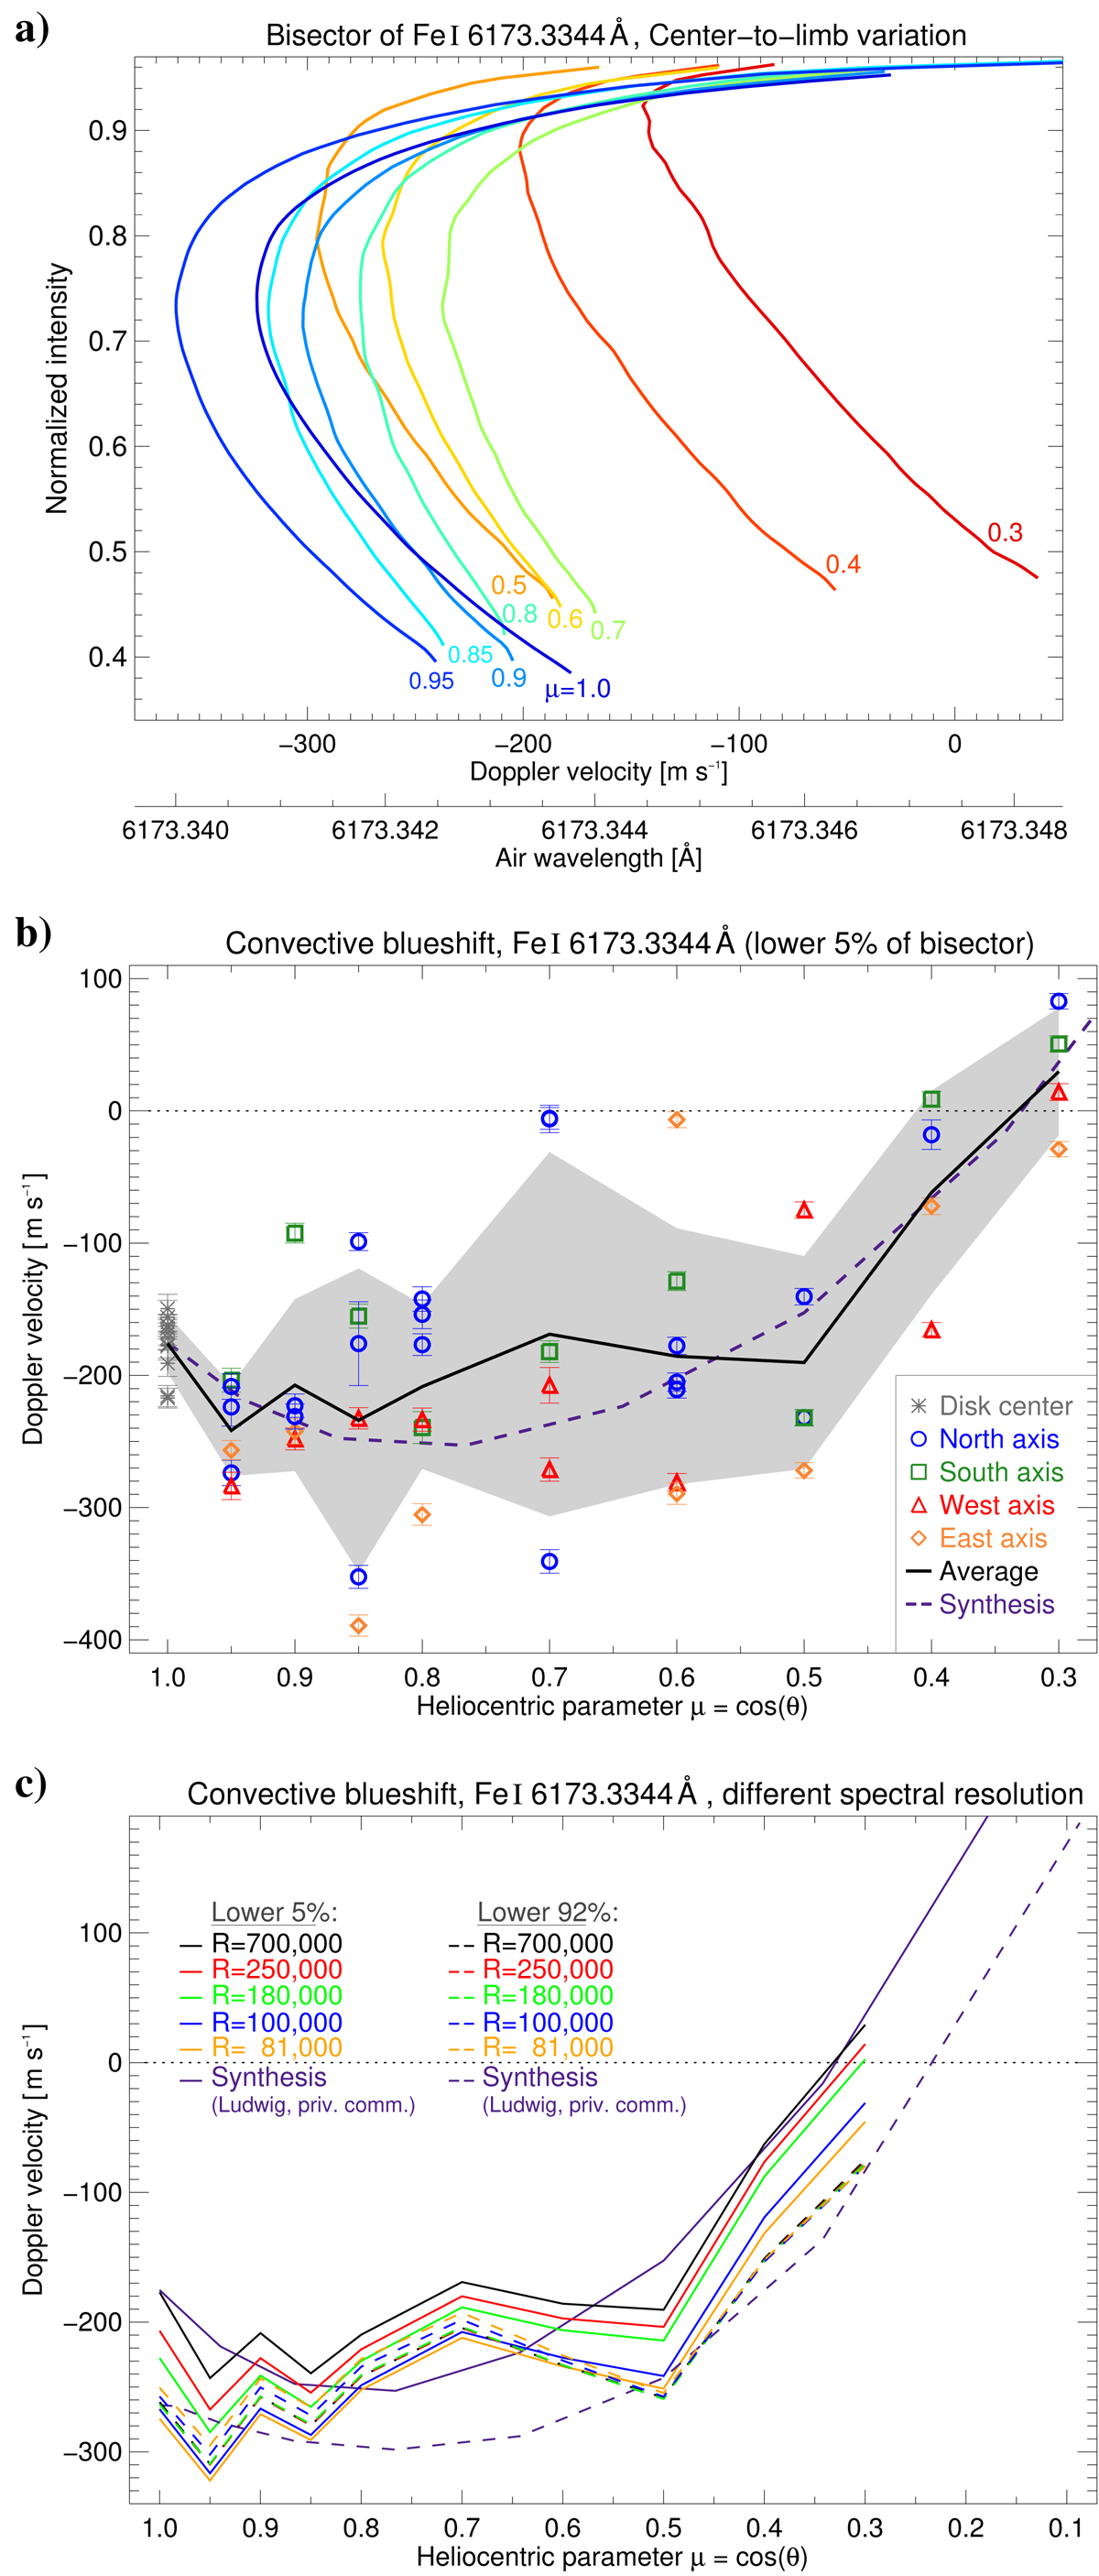
Center-to-limb variation of the Fe I 6173.3 Å line. Panel a: displays the average line bisectors from the disk center (μ = 1.0) toward the solar limb (μ = 0.3). Panel b: average convective blueshift of the line core (lower 5% of the bisectors) for each observation. Colors and symbols indicate the axes. The average curve and its standard deviation are displayed as black solid line and gray shaded area. Panel c: compares the observed convective blueshift for different spectral resolutions and line sections. Dashed lines are close to each other or even overlay. The observations are compared with the synthesis of H.-G. Ludwig (priv. commun.).
Current usage metrics show cumulative count of Article Views (full-text article views including HTML views, PDF and ePub downloads, according to the available data) and Abstracts Views on Vision4Press platform.
Data correspond to usage on the plateform after 2015. The current usage metrics is available 48-96 hours after online publication and is updated daily on week days.
Initial download of the metrics may take a while.