Fig. 9
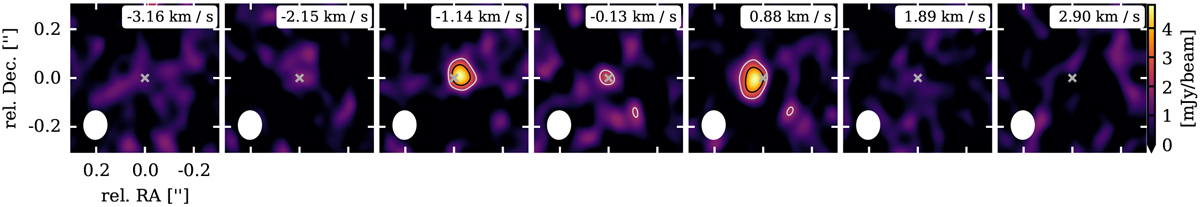
12CO J = 3−2 (ALMA B7) synthetic channel intensity maps for a CS Cha companion model. The grey cross indicates the location of the PMC. The white ellipse in each panel shows the beam with a size of 0.11′′ × 0.09′′. In the top right corner of each panel the velocity relative to the systemic velocity is indicated. The grey and black contours show 3 and 5 times the theoretical rms level of 0.65 mJy beam−1 (see Table C.1). The measured rms levels in the shown channels are approximately in the range 0.49 − 0.76 mJy beam−1. The measured peak flux is about 4.8 mJy beam−1.
Current usage metrics show cumulative count of Article Views (full-text article views including HTML views, PDF and ePub downloads, according to the available data) and Abstracts Views on Vision4Press platform.
Data correspond to usage on the plateform after 2015. The current usage metrics is available 48-96 hours after online publication and is updated daily on week days.
Initial download of the metrics may take a while.