Fig. 5
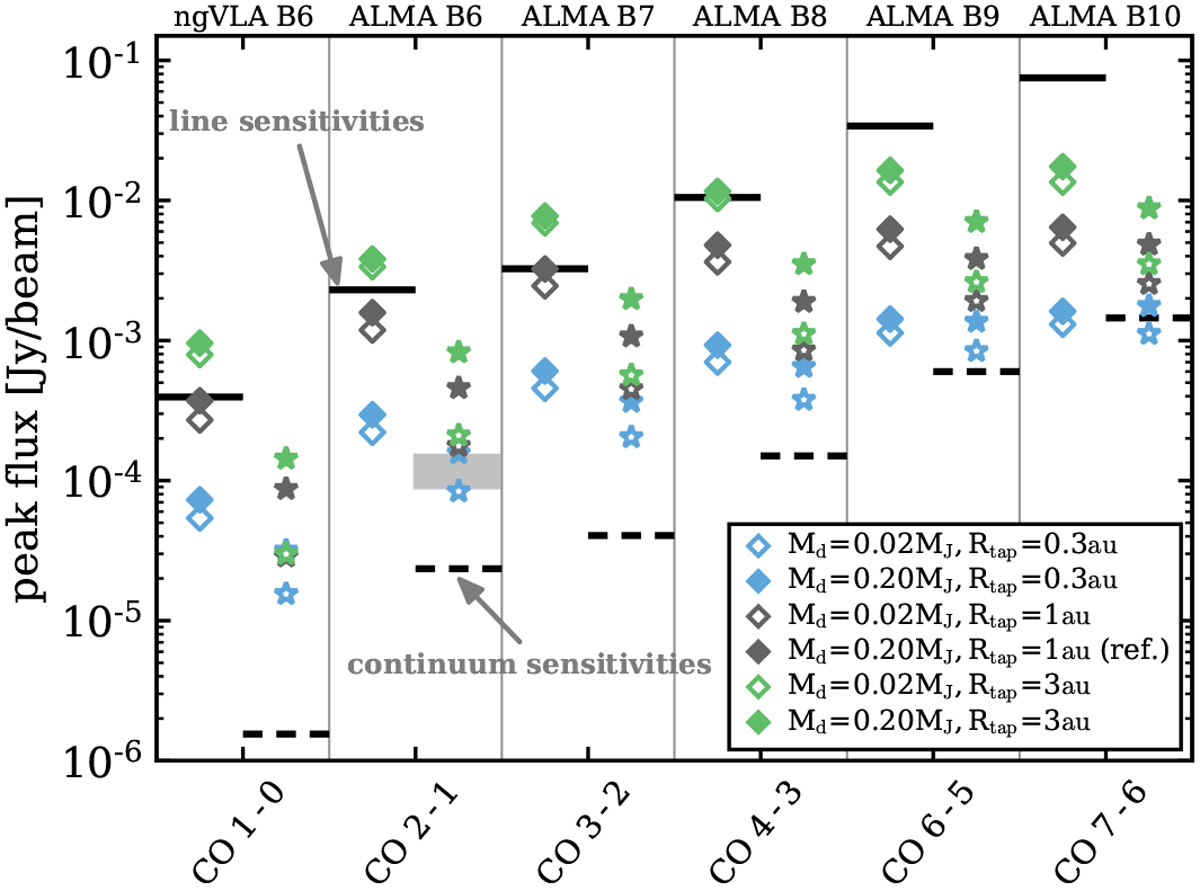
Comparison of 12CO line and continuum peak fluxes from CPD models with varying structure properties (radius and mass) to 5σ detection limits for one band of ngVLA and various ALMA bands (see Appendix C for details). The dust emission is reported at the same wavelength as the corresponding line. A beam of 0.1′′ × 0.1′′ is assumed. For the lines a channel width of 1 km s−1 was used. The peak flux is the maximum flux value in the synthetic images; for the lines all channels are considered to evaluate the peak flux (see Appendix D for details). The diamond symbols show the fluxes for the lines and the star symbols the corresponding continuum fluxes. The black solid and dashed lines indicate the sensitivity limits for the line and continuum, respectively. The light grey box shows the range of 3σ sensitivity levels as reported by Wu et al. (2017a) for their ALMA Band 6 continuum non-detections of a sample of wide-orbit PMCs.
Current usage metrics show cumulative count of Article Views (full-text article views including HTML views, PDF and ePub downloads, according to the available data) and Abstracts Views on Vision4Press platform.
Data correspond to usage on the plateform after 2015. The current usage metrics is available 48-96 hours after online publication and is updated daily on week days.
Initial download of the metrics may take a while.