Fig. 3
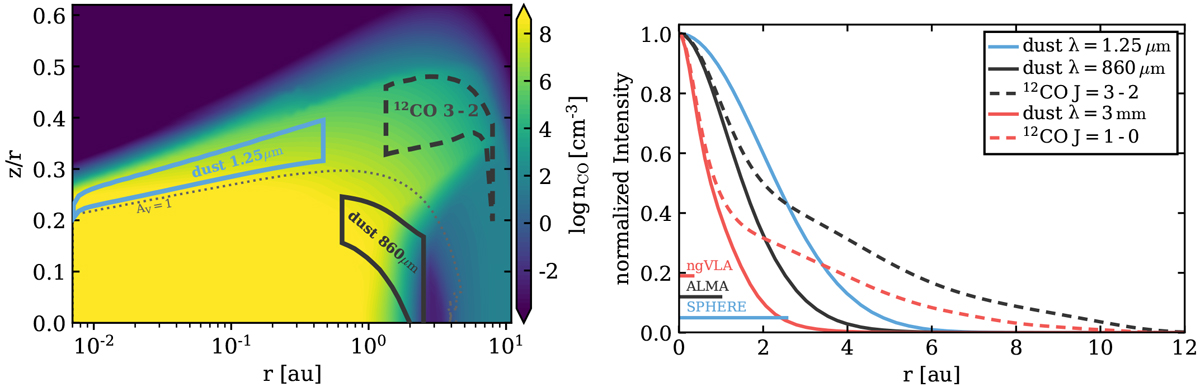
Left panel: location of the main emitting region for the near-infrared and (sub)mm dust emission and the 12CO J = 3 − 2 line in the reference model. The vertical lines of the boxes denote the radii where the cumulative flux in radial directions reaches 15 and 85%, respectively. The horizontal lines denote the heights where the cumulative flux integrated vertically reaches 15 and 85% at each radial position. The coloured contours show the CO number density and the dotted grey line shows where the visual extinction AV reaches unity. Right panel: normalized radial intensity profiles (azimuthally averaged) for the dust continuum and line images. Shown are profiles derived from images convolved with representative beam sizes for SPHERE (blue, FWHM = 0.031′′), ALMA (black, FWHM = 0.012′′), and ngVLA (red, FWHM = 0.004′′).
Current usage metrics show cumulative count of Article Views (full-text article views including HTML views, PDF and ePub downloads, according to the available data) and Abstracts Views on Vision4Press platform.
Data correspond to usage on the plateform after 2015. The current usage metrics is available 48-96 hours after online publication and is updated daily on week days.
Initial download of the metrics may take a while.