Fig. G.1
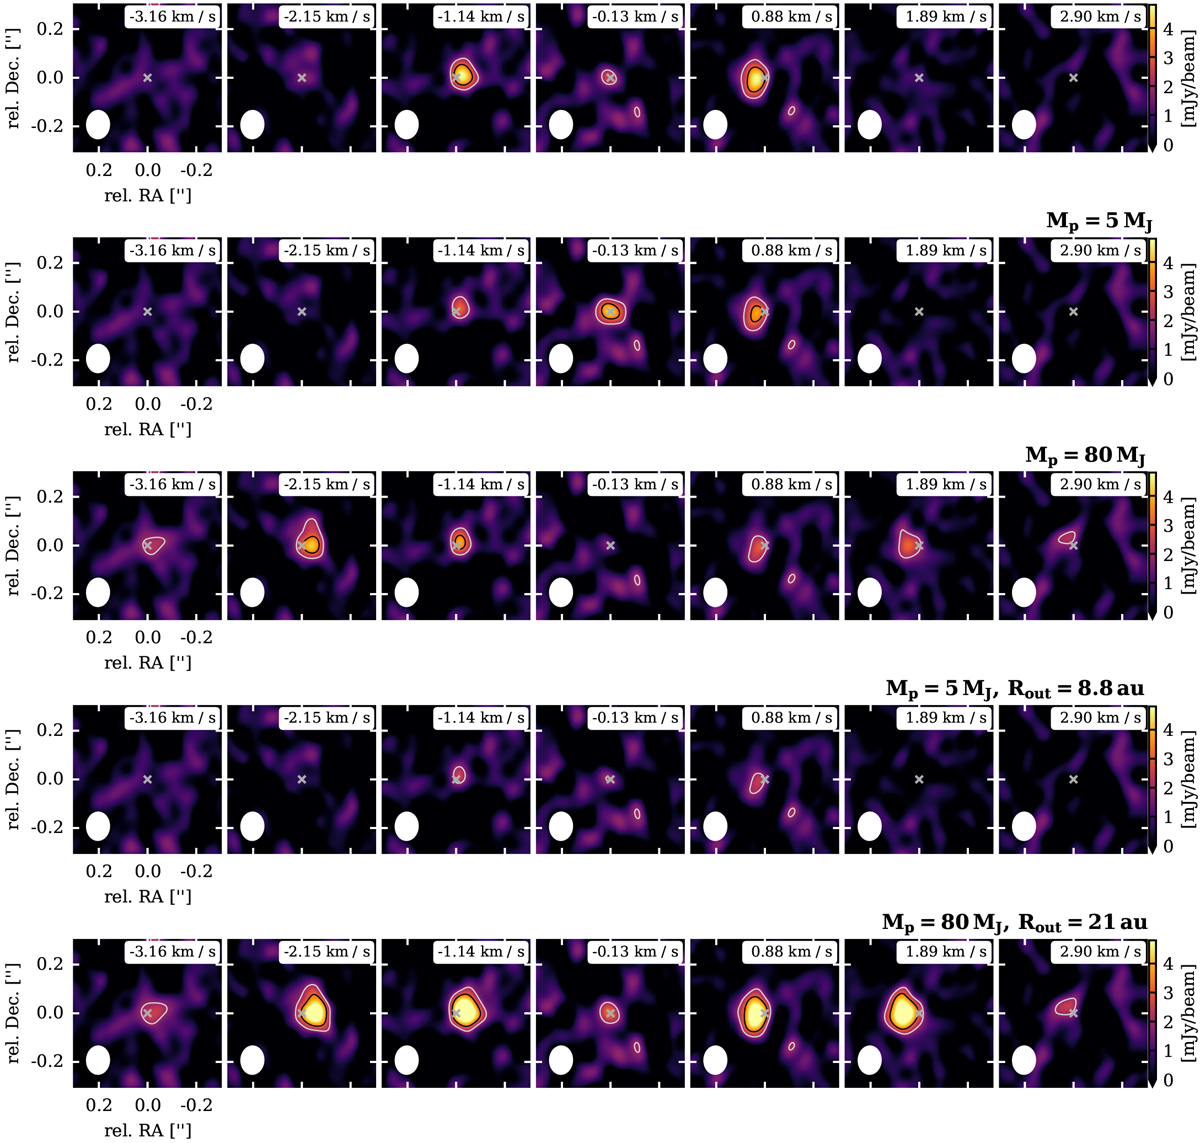
12CO J = 3−2 (ALMA Band 7) synthetic channel intensity maps for CS Cha companion models. The grey cross indicates the central target location. The white ellipse in each panel shows the beam with a size of 0.11′′ × 0.09′′. In the top right corner of each panel the velocity relative to the systemic velocity is indicated. The grey and black contours show 3 and 5 times the theoretical rms level of 0.65 mJy beam−1 (see Table C.1). Top row: same model as in Fig. 9 (Sect. 3.5) for easier comparison. Second and third rows: models where only the PMC mass was changed. Last two rows: the disk outer radius was adapted to rHill∕3 according to the PMC mass. The spatial and colour scale are the same for all five plots.
Current usage metrics show cumulative count of Article Views (full-text article views including HTML views, PDF and ePub downloads, according to the available data) and Abstracts Views on Vision4Press platform.
Data correspond to usage on the plateform after 2015. The current usage metrics is available 48-96 hours after online publication and is updated daily on week days.
Initial download of the metrics may take a while.