Fig. 11
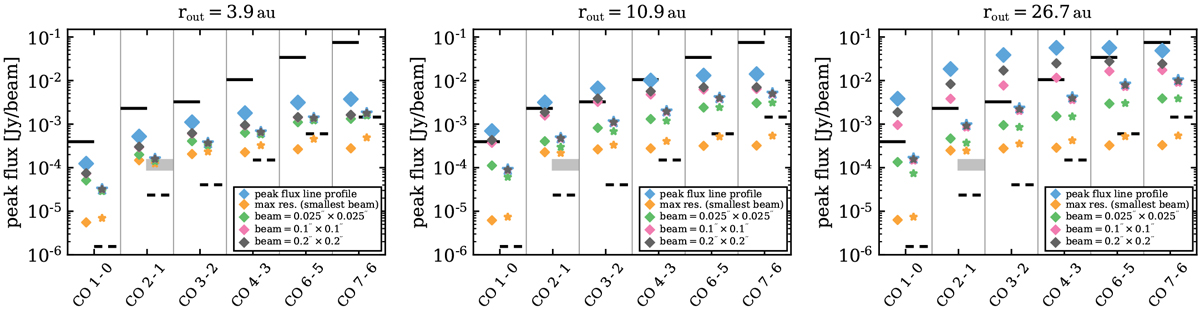
Impact of the beam size on the observed fluxes. Each individual panel shows the same kind of plot as shown in Fig. 5. In each panel one model with a certain disk extension is shown. For each of these models, the peak fluxes using different beam sizes are reported (coloured symbols in each panel). As a reference also the given line peak flux (blue diamonds) as derived from the line profile is shown (i.e. is not per beam). For the continuum, the big blue stars show the total integrated flux.
Current usage metrics show cumulative count of Article Views (full-text article views including HTML views, PDF and ePub downloads, according to the available data) and Abstracts Views on Vision4Press platform.
Data correspond to usage on the plateform after 2015. The current usage metrics is available 48-96 hours after online publication and is updated daily on week days.
Initial download of the metrics may take a while.