Open Access
Fig. 9
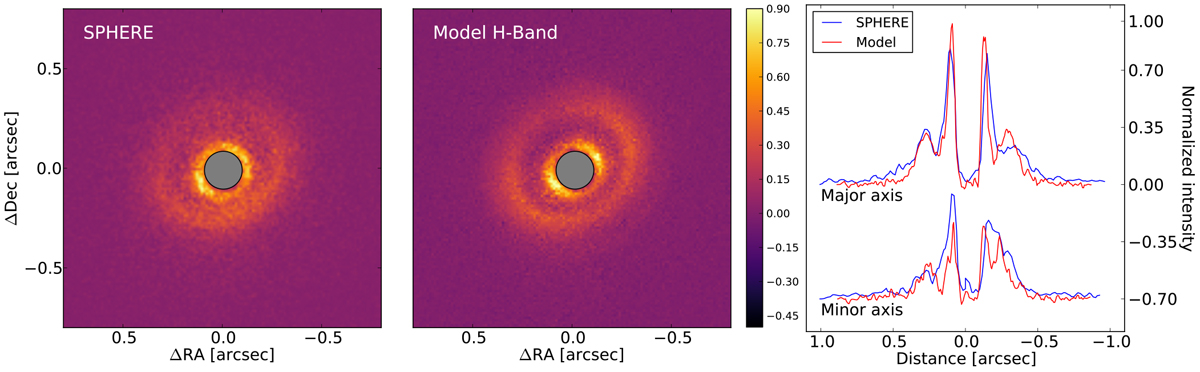
Left panel: observed PI image of J1852. Middle panel: PI model map. Both maps are normalized to their maximum. Right panel: radial cuts along the major and minor axis for the PI images of the data and the model. Each curve is convolved with a Gaussian kernel with a standard deviation of 11 mas.
Current usage metrics show cumulative count of Article Views (full-text article views including HTML views, PDF and ePub downloads, according to the available data) and Abstracts Views on Vision4Press platform.
Data correspond to usage on the plateform after 2015. The current usage metrics is available 48-96 hours after online publication and is updated daily on week days.
Initial download of the metrics may take a while.